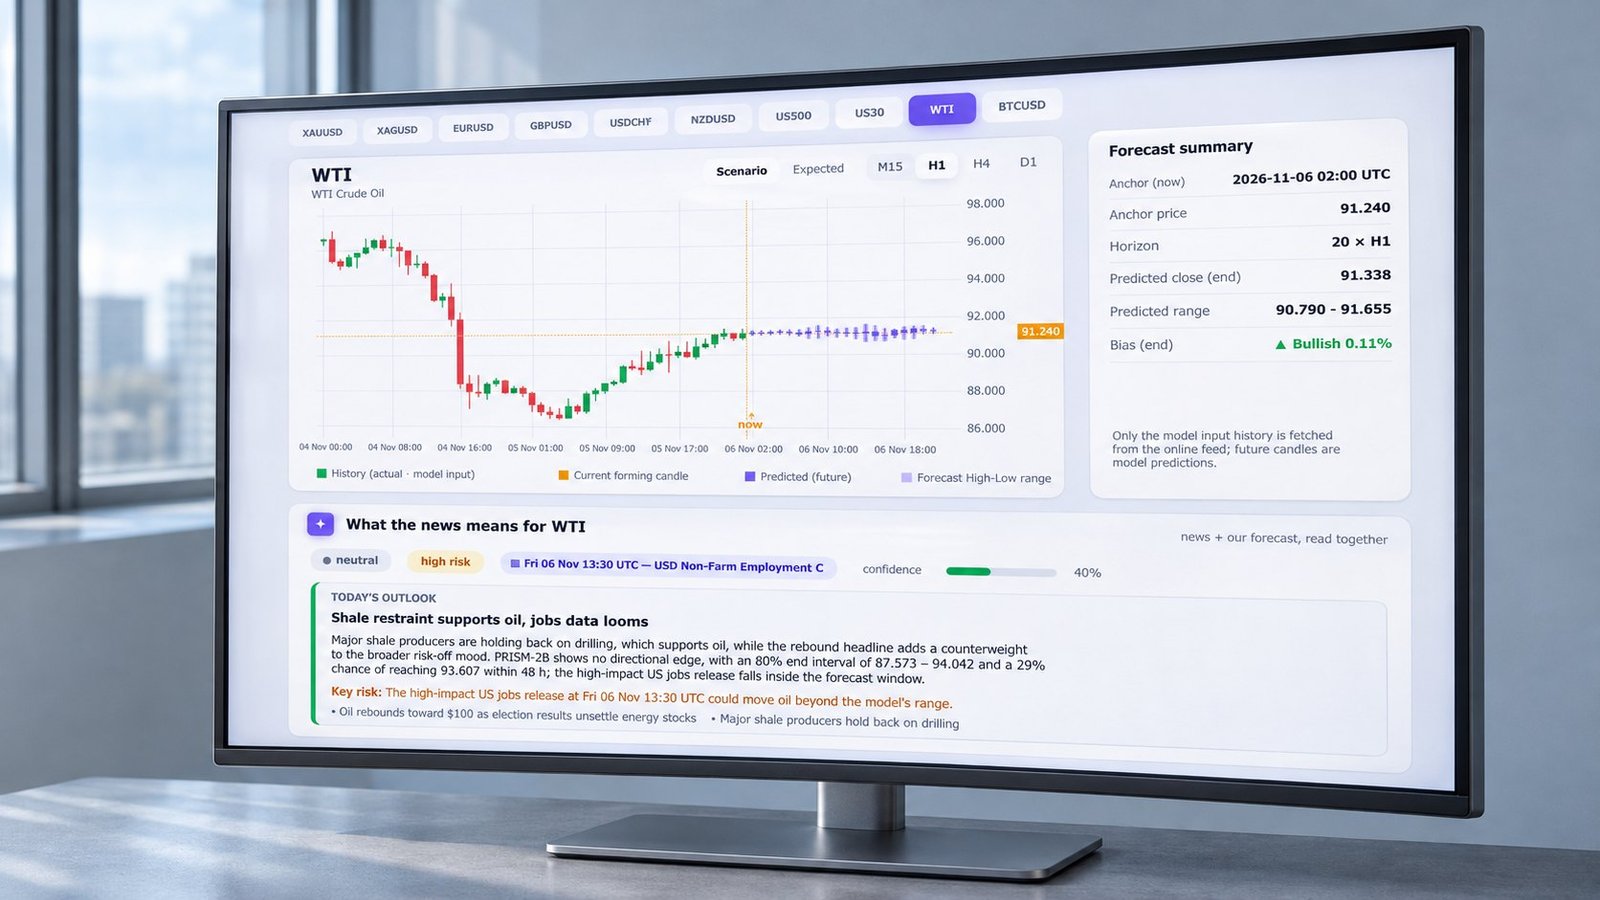
Oil Price After Jobs Report: Reading WTI Forecasts
See how payrolls move WTI through demand, rates and the dollar, then read PRISM's M15, H1, H4 and D1 forecast ranges with measured limits.
Oil Futures Curve for Short-Horizon Forecasts
Learn how the oil futures curve, roll state, and horizon condition PRISM’s re-anchored OHLC forecasts without treating futures as spot-price promises.
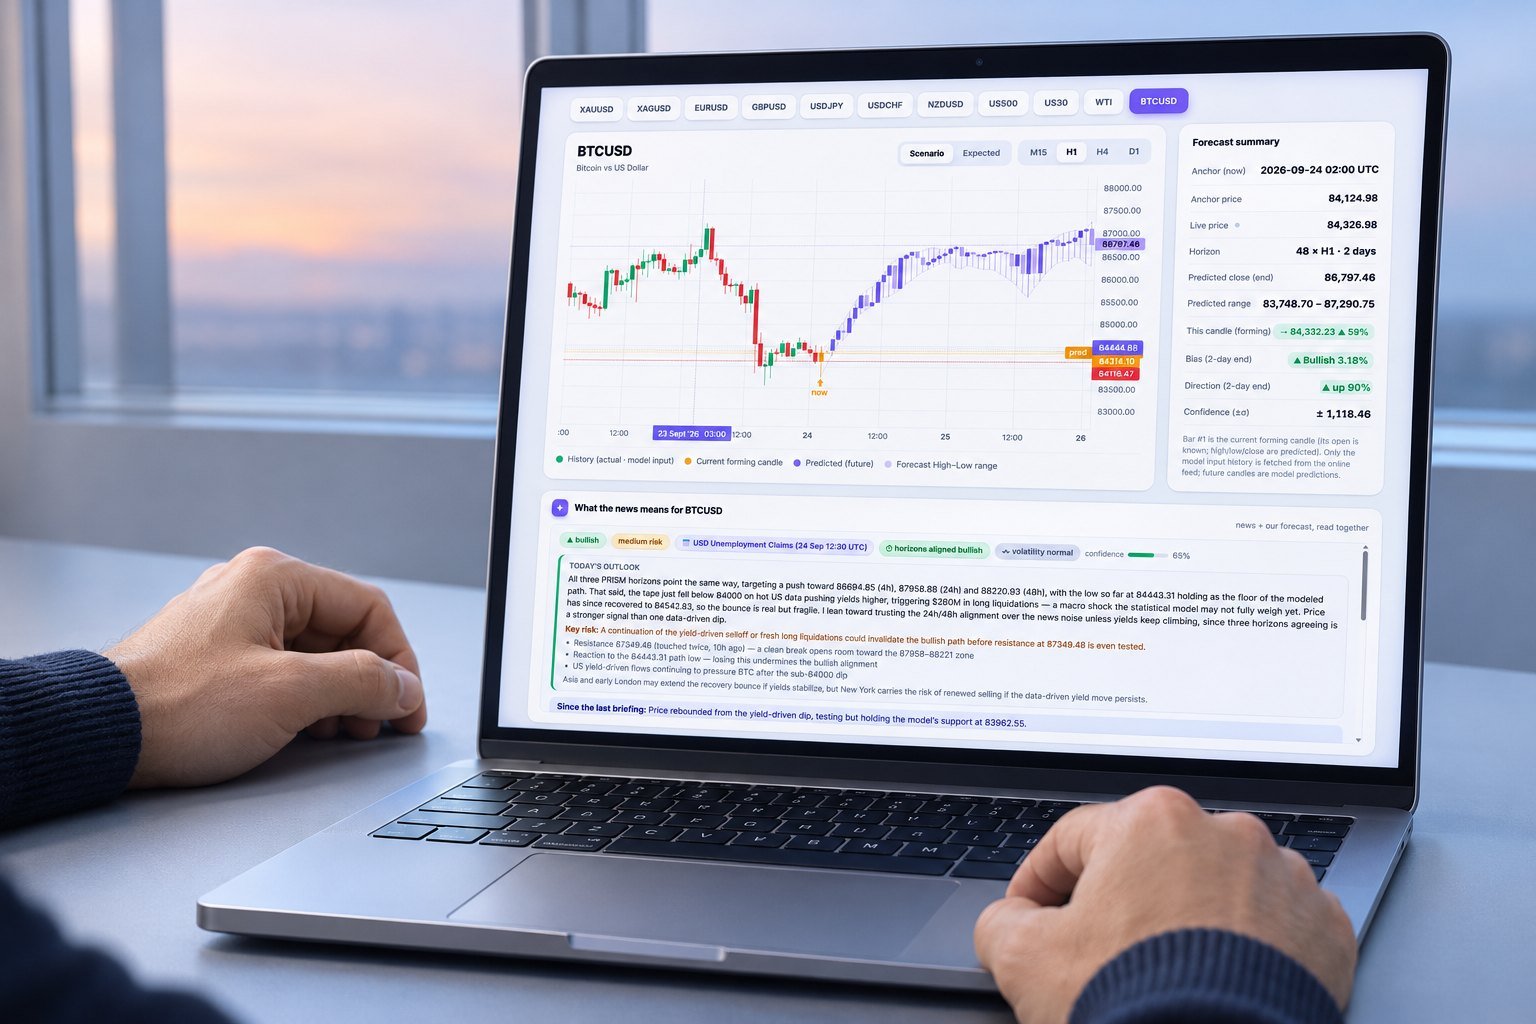
Bitcoin CPI Reaction: Reading Forecast Shocks
Learn how to read bitcoin CPI reaction across yields, the dollar and multi-timeframe OHLC forecasts, including reversals and liquidity risk.
Prediction Markets: A Practical Buyer Guide
Learn how prediction markets price event contracts, how venues settle trades, where odds fail, and how PRISM adds continuous-price context.
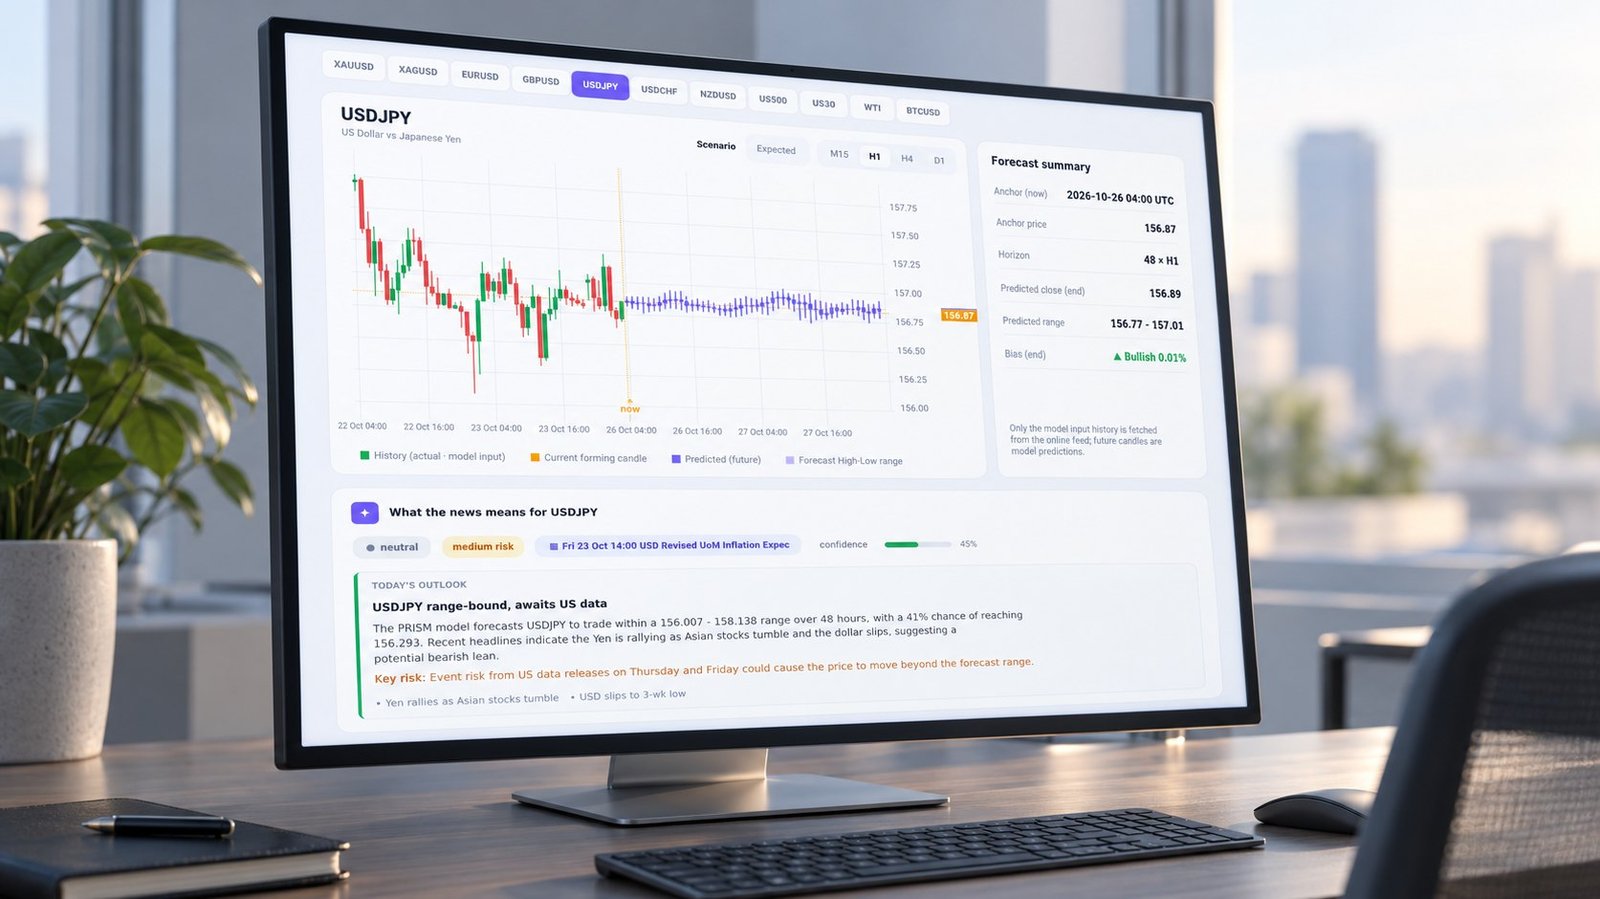
USD JPY intervention risk in a live forecast
Learn how to read USD JPY intervention risk across M15, H1, H4 and D1 forecasts, measure range coverage, and spot regime-break failure.
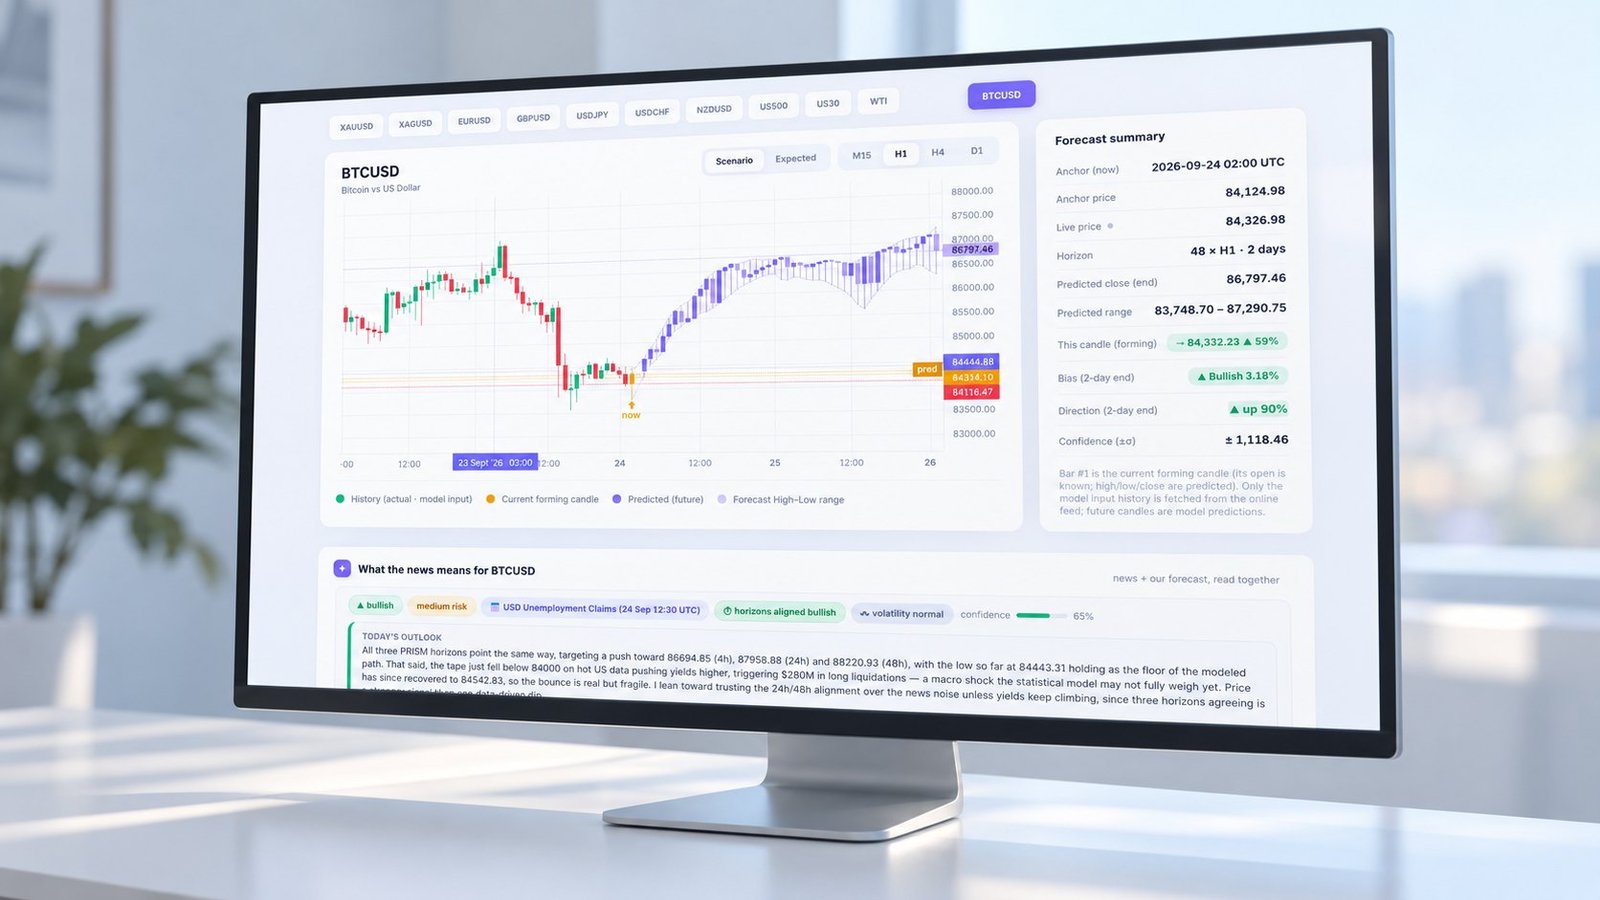
Bitcoin Dollar Correlation: Reading DXY Regimes
Learn how bitcoin dollar correlation shifts by regime, how DXY and yields change the signal, and how PRISM tests M15, H1, H4 and D1 forecasts.
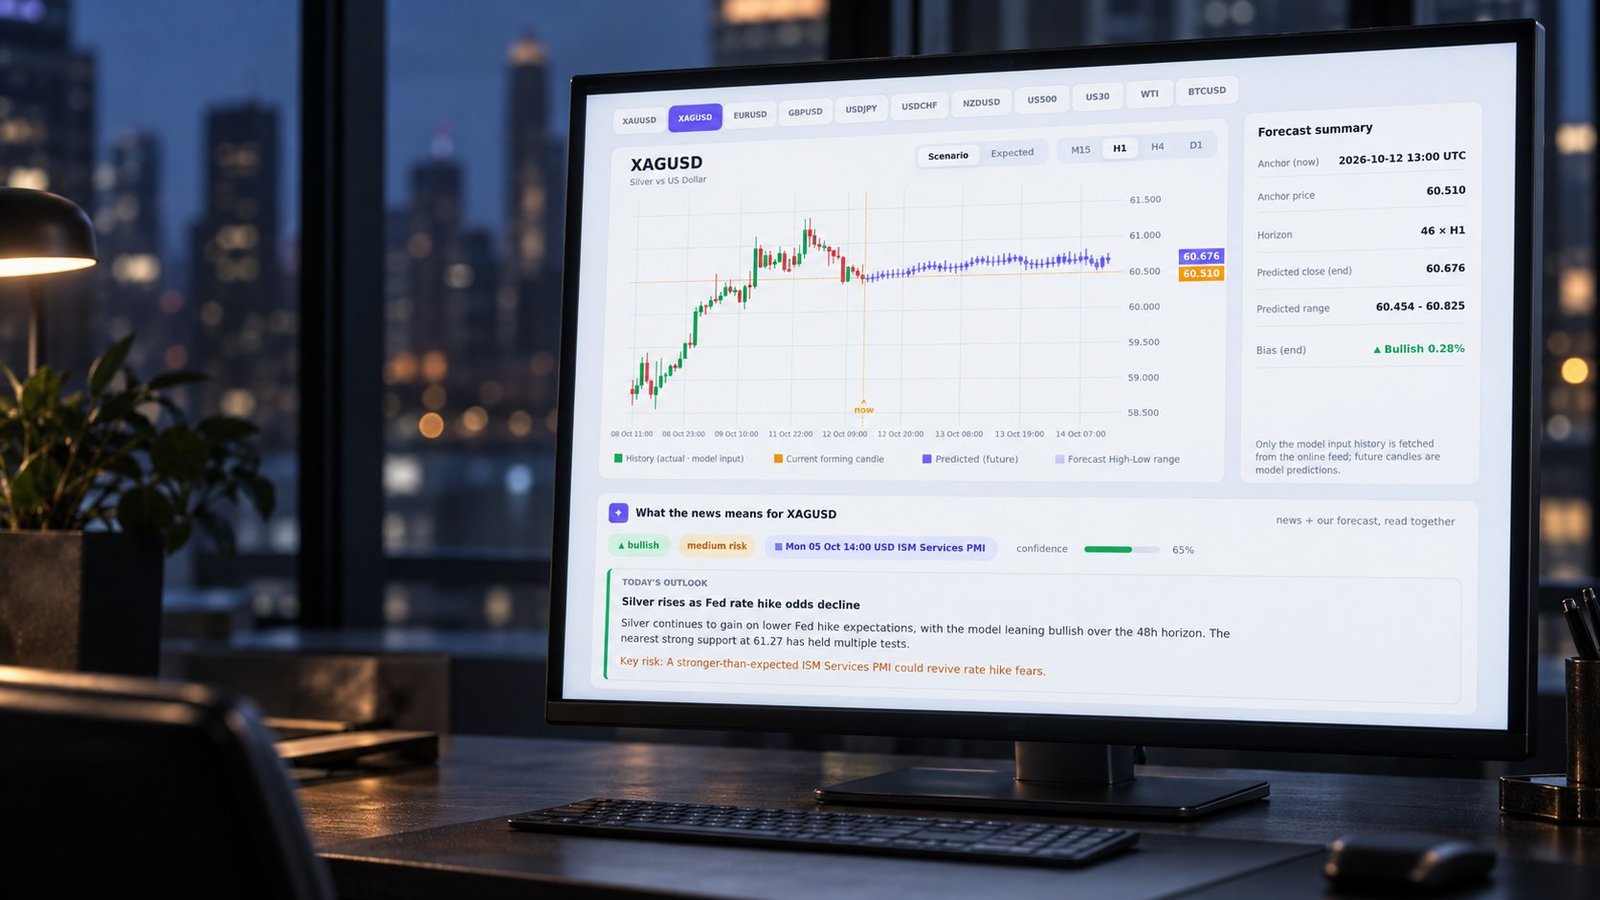
Silver Futures Weekend Trading: Re-Anchor or Not?
Should you re-anchor silver futures weekend trading? See CME’s SIC clock, first-weekend volume, PRISM’s 11–14 September audit, and failure modes.
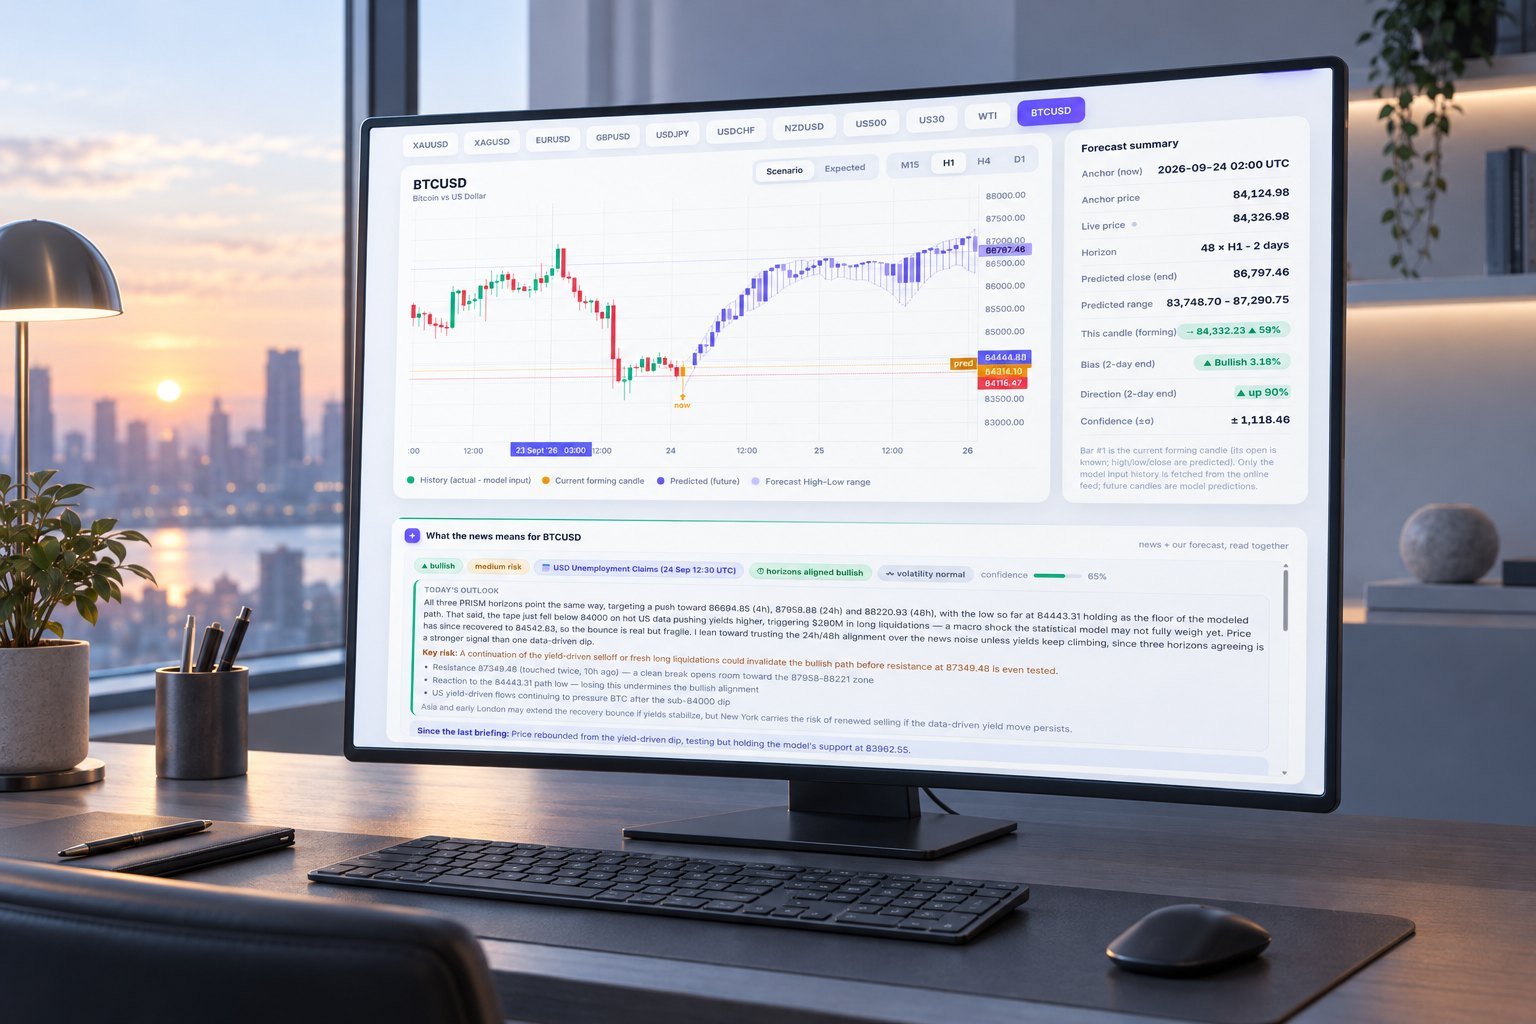
Bitcoin Weekend Volatility and Forecast Failure
Bitcoin weekend volatility is quieter on average but fragile at the tails. Compare CME, Hyperliquid, Glassnode and PRISM’s 48-hour forecast tests.
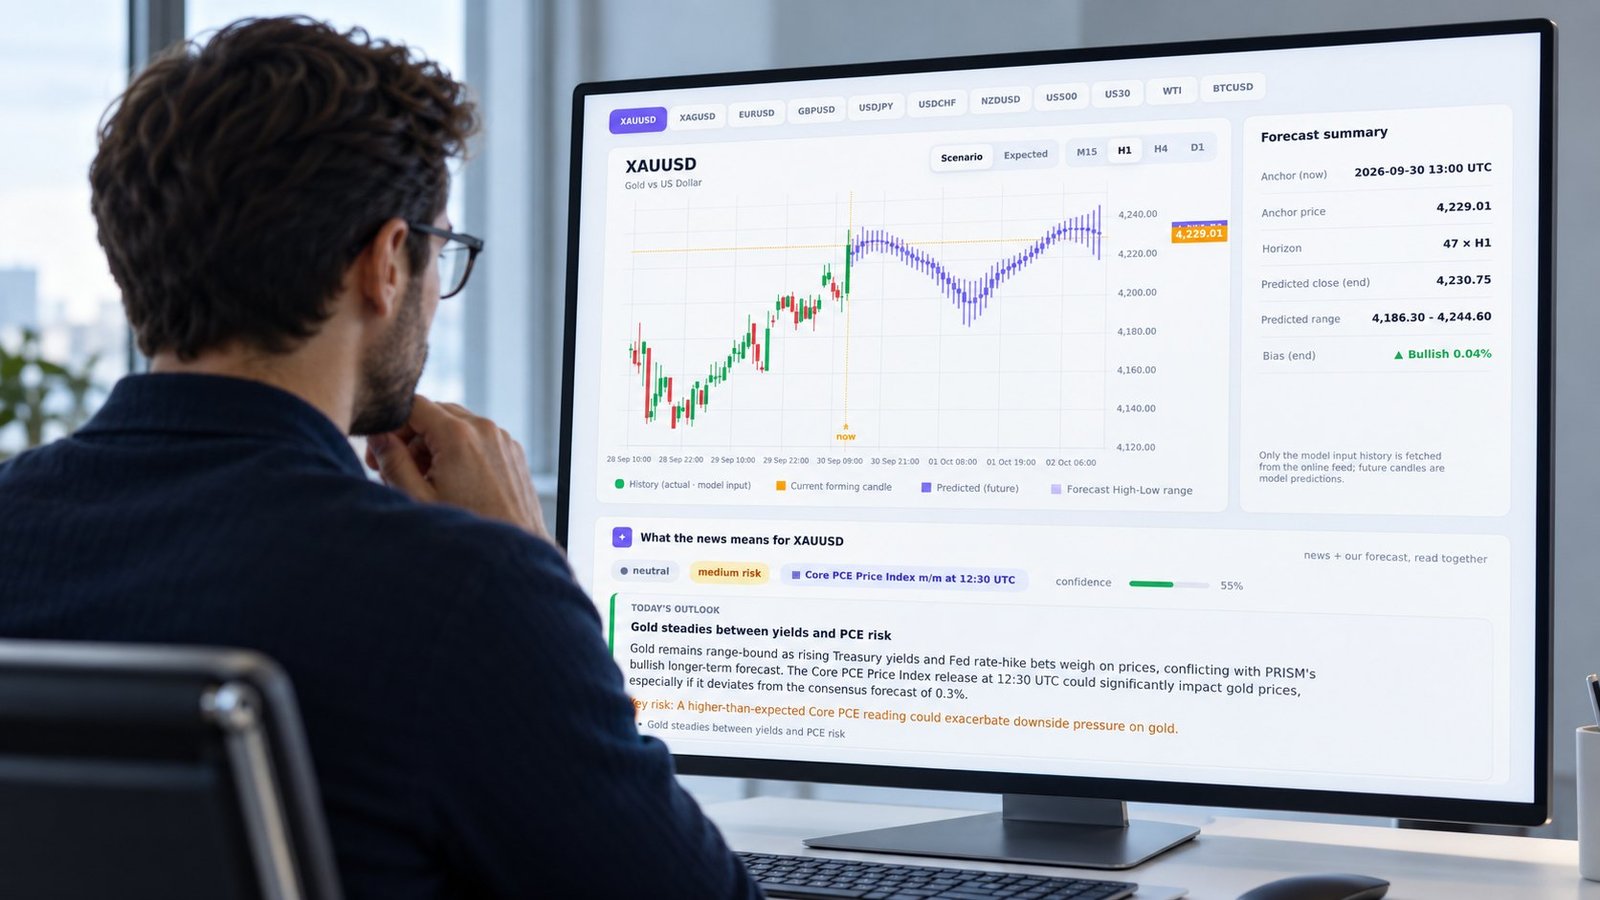
Gold ETF Holdings vs Flows: A Trading Test
Learn how gold ETF holdings vs flows differ, how AUM misleads, and how PRISM aligns slow ETF data with 48-hour XAUUSD forecasts.
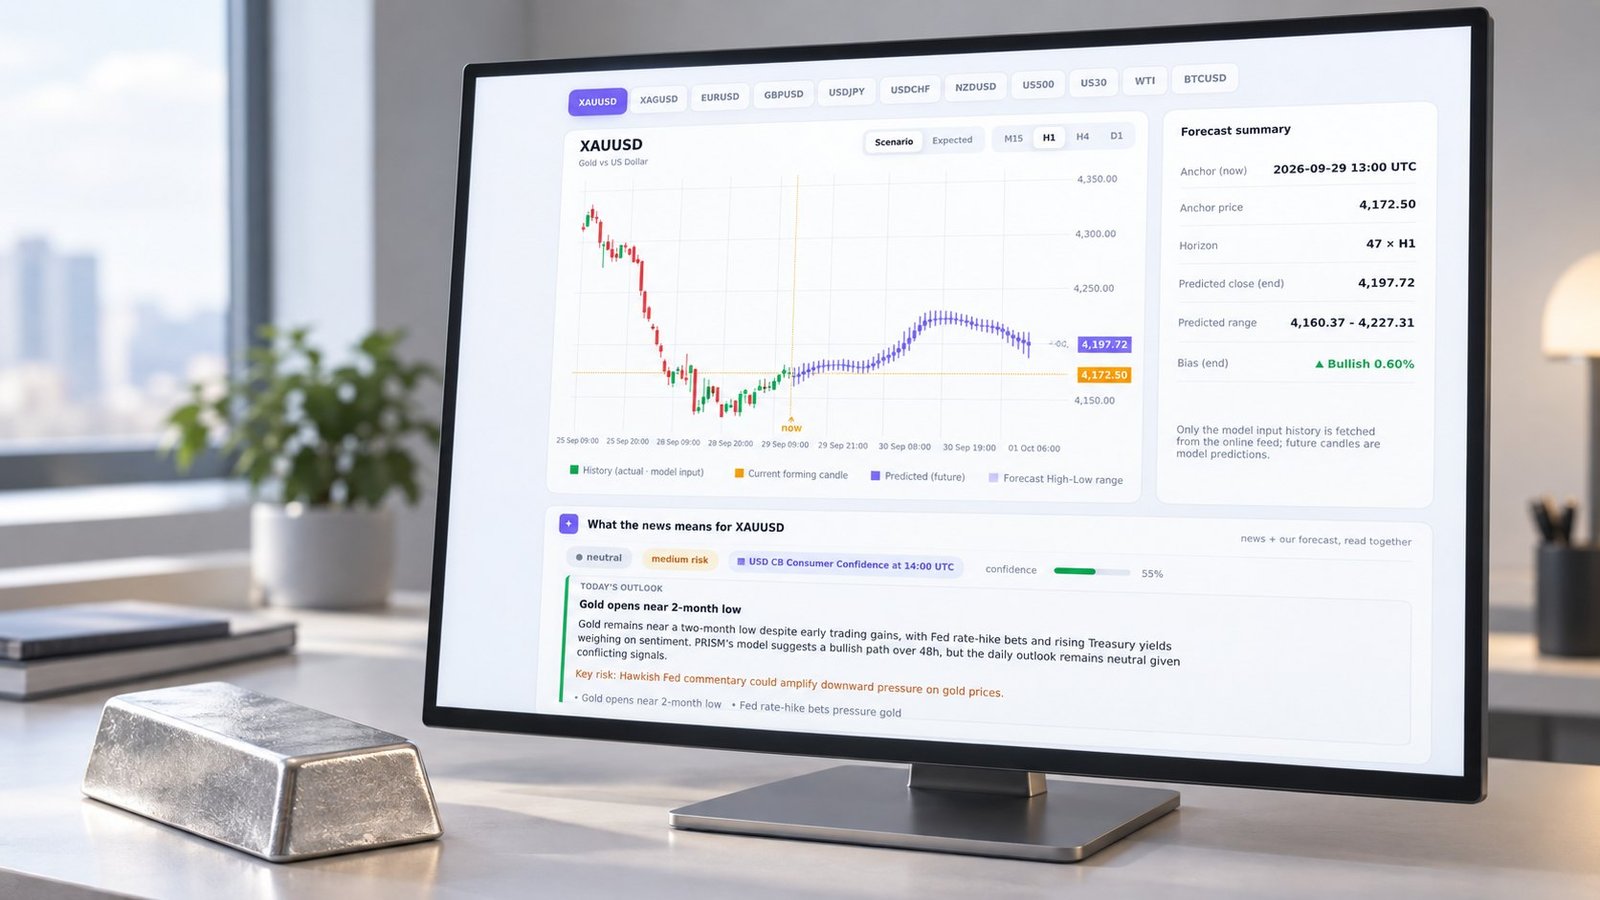
How Interest Rates Affect Silver
Learn how interest rates affect silver by tracing real yields, the dollar, and priced-in surprises across PRISM’s 48-hour forecast horizons.
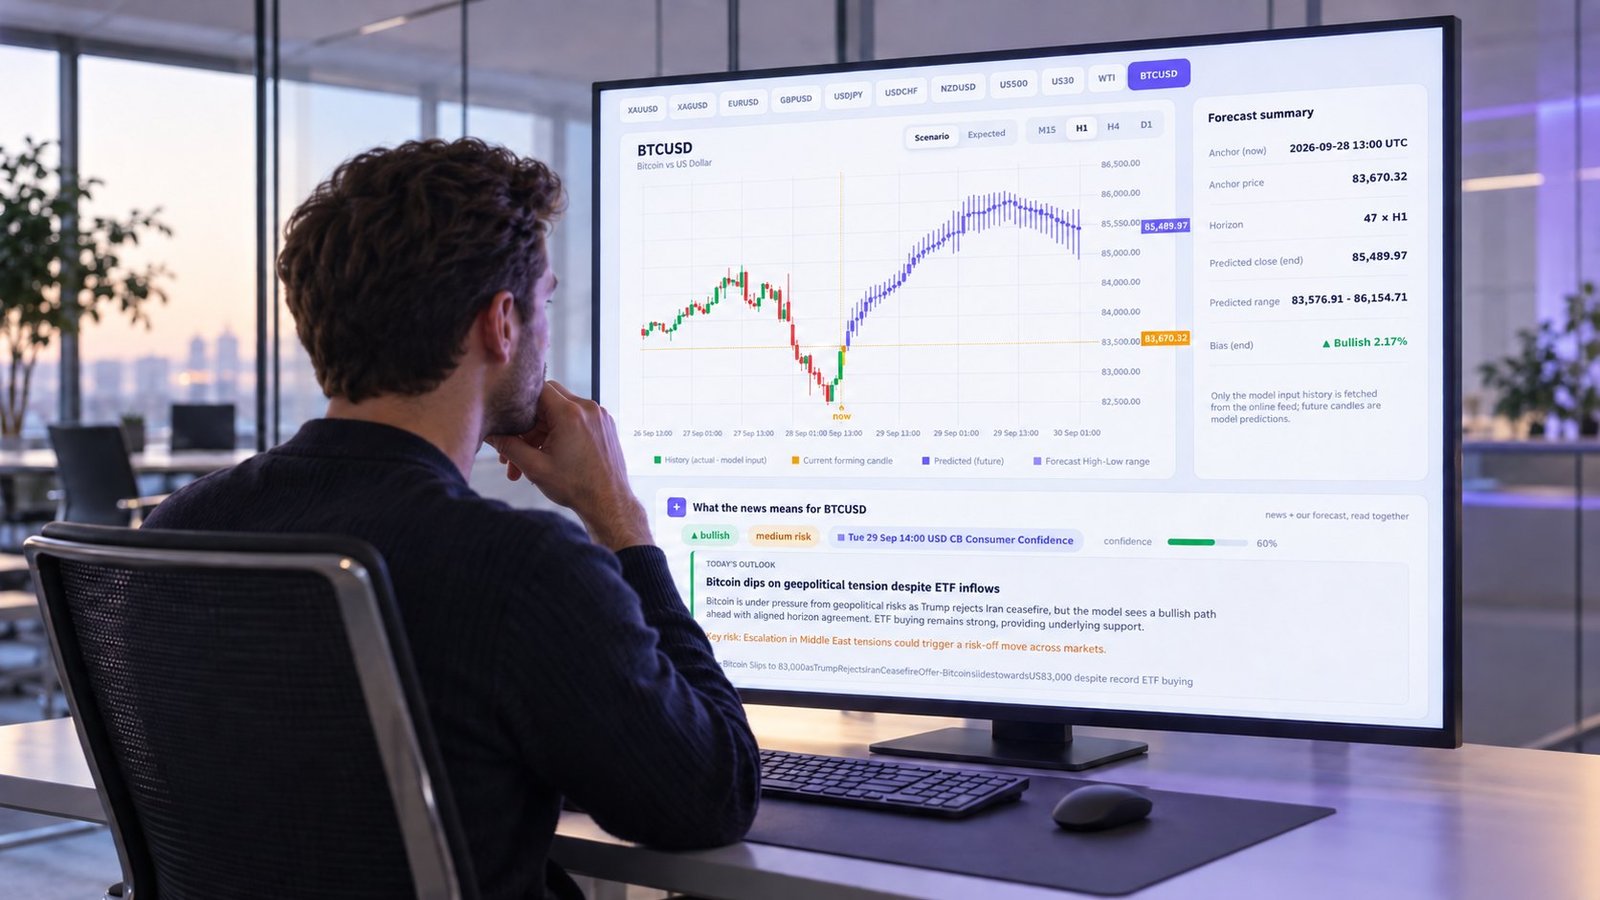
Bitcoin Liquidity: Reading Forecast Uncertainty
Learn how bitcoin liquidity shocks alter short-horizon forecast confidence with Treasury yields, DXY, Fed measures, OHLC ranges, and 15-minute re-anchoring.
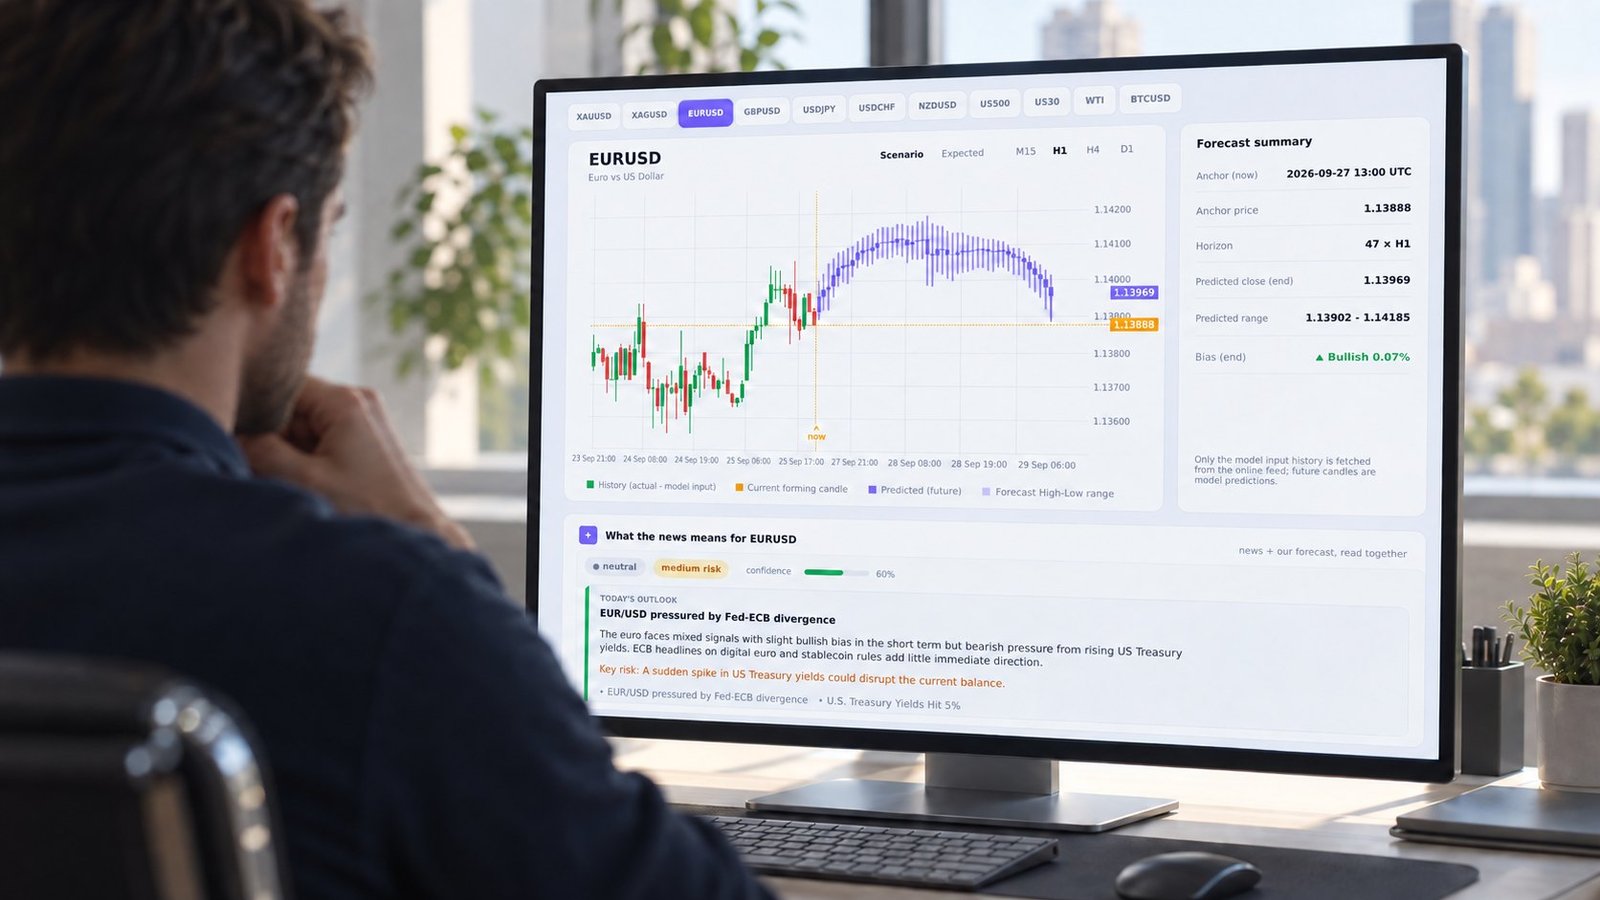
EUR/USD forecast vs spot: From consensus to candles
Compare EUR/USD bank targets with PRISM's 48-hour OHLC forecasts. Measure pip gaps, forecast dispersion, and horizon mismatch before acting.
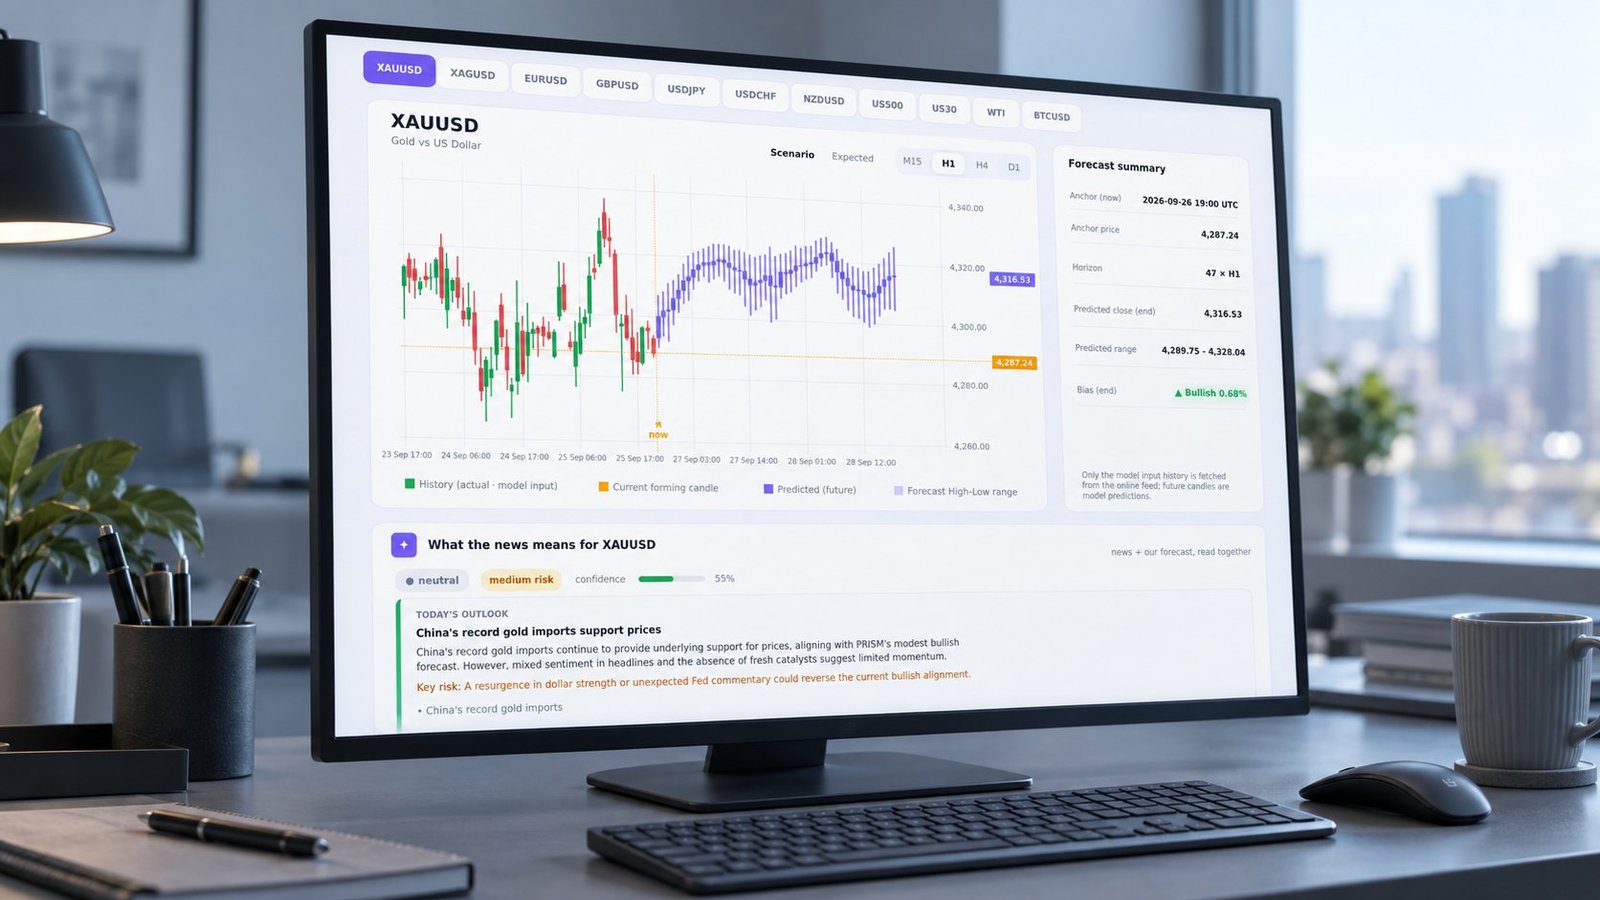
How Real Yields Affect Gold in PRISM Forecasts
Learn how real yields affect gold, separate nominal from inflation-adjusted rates, and read conflicting M15-to-D1 signals in a 48-hour forecast.
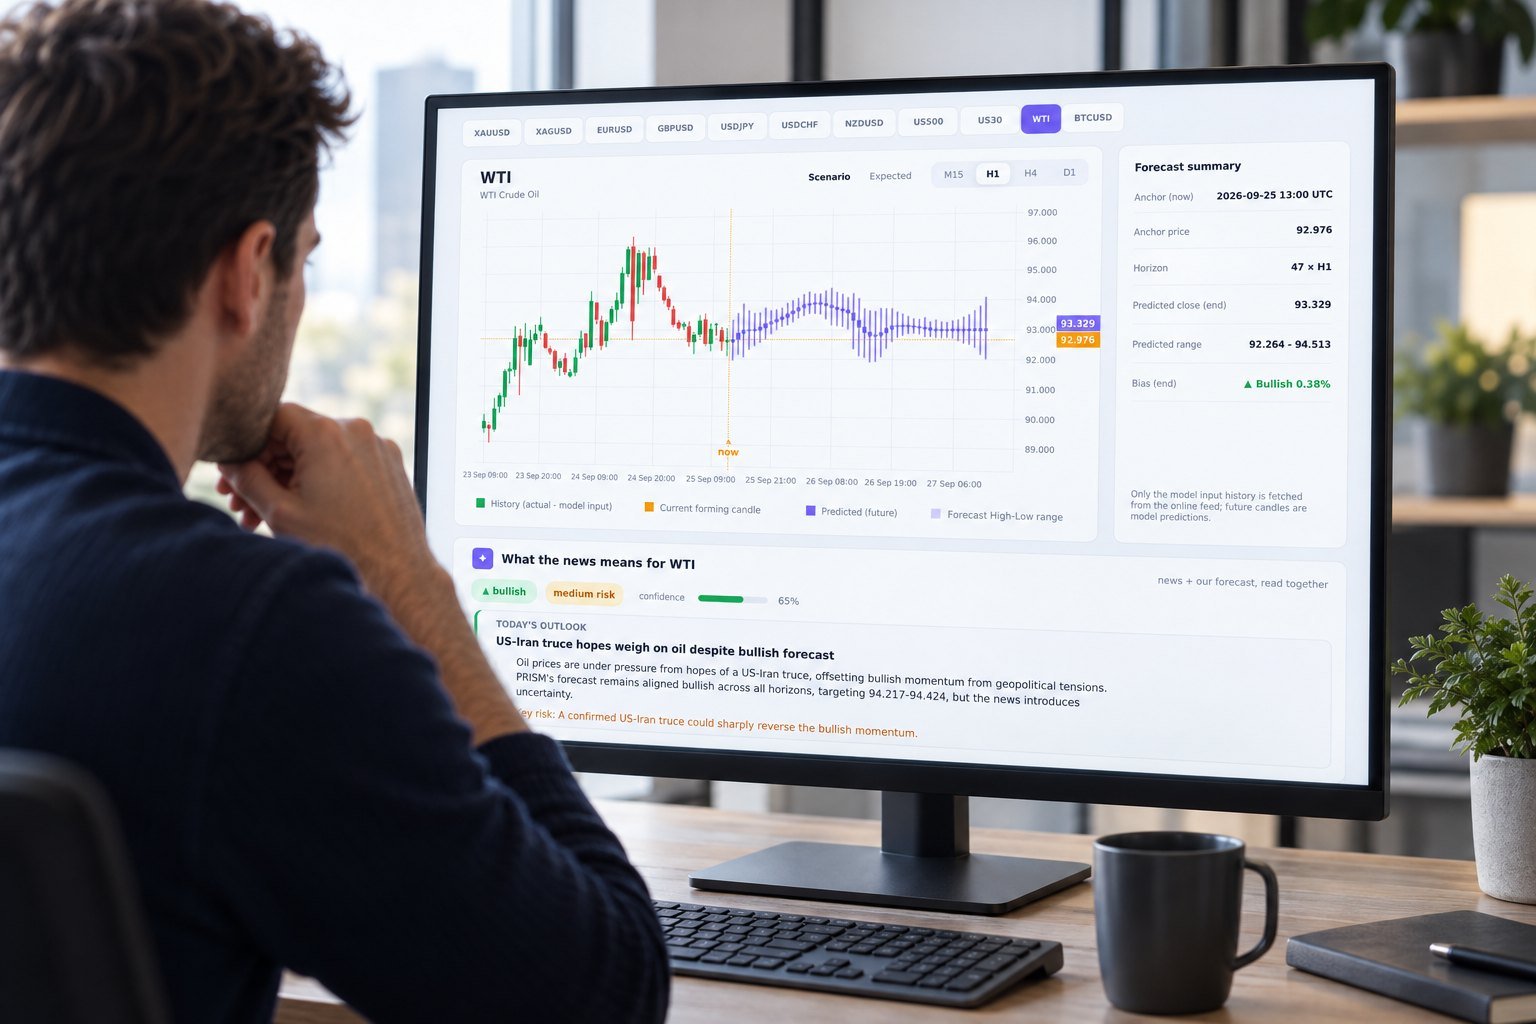
Oil Price Expectations Across Forecast Horizons
Learn how to reconcile oil price expectations, compare OPEC, IEA and bank outlooks, and test long-horizon revisions against PRISM WTI OHLC behavior.

Oil Price Projections: Reading Inventory Data
Build better oil price projections by separating stocks, flows, estimates, and timing—then read WTI’s 48-hour OHLC forecast with context.

Gold Investment Prediction: Can ETF Flows Confirm?
Can ETF flows confirm a gold investment prediction? Compare WGC timing with PRISM's M15, H1, H4 and D1 forecast validation.
Gold Market Prediction Across 48 Hours
Compare a gold market prediction across M15, H1, H4 and D1 with OHLC paths, direction probability, confidence and invalidation.

Forex Predict Candles MT5 Tester: Honest Scoring
Learn how to run a no look-ahead MT5 candle forecast backtest with real ticks, first-tick locks, CSV fields, and post-close OHLC scoring.

How to Evaluate a Forex Prediction API
Choose a forex prediction API with aligned candles, fresh anchors, uncertainty fields, cache rules, and tests for stale or malformed payloads.

Forex Prediction Central Bank Divergence
Learn how forex prediction central bank divergence affects candle reactions and how PRISM forecasts help compare rate-path shifts across timeframes.
Forex Forecast Backtest Overfitting Explained
Most AI forex accuracy claims come from a single optimized backtest. See why forex forecast backtest overfitting inflates results — and what fixes it.

Forex Volatility Position Sizing for a Widening Market
Forex volatility position sizing usually runs on trailing ATR. See how a forward-looking 48-hour forecast range flags expansions before ATR does.

The Most Predictable Forex Pairs, By the Data
Which are the most predictable forex pairs? A 2025 ML study shows accuracy varies by pair — here's what to check before trusting any forecast.

Does Forex Prediction Indicator Repaint?
Does forex prediction indicator repaint? No — see the technical definition, a 4-point test, and how PRISM's 15-minute re-anchoring differs from repainting.

Forex Prediction Range Forecast: Point vs OHLC
Learn how a forex prediction range forecast compares with point targets, OHLC ranges, timeframes, and invalidation using EUR/USD and USD/JPY.

Forex Prediction Model Validation for Buyers
Forex prediction model validation for AI vendors: test backtests, calibration, drift, versioning, data lineage, and live forecast records.

Energy Shock Forex Prediction for 48 Hours
Energy shock forex prediction for the next 48 hours, with PRISM OHLC candles, ECB energy inflation, and USD/CAD and EUR/NOK signal checks.
MT5 AI Forex Prediction: What Build 6180 Adds
MT5 builds 6060-6180 added an AI Assistant and MCP. Here is why mt5 ai forex prediction still needs a model that outputs forward OHLC candles.

Multi-Timeframe Analysis Forex: Fixing Stale Bias
Multi-timeframe analysis forex traders use to align higher-timeframe bias with lower-timeframe entries, and how to catch a stale bias before it costs you.

The Fed Rate Decision September 2026 Forex Playbook
The Fed rate decision September 2026 forex reaction is two-sided: see how EUR/USD, GBP/USD, USD/JPY and USD/CAD could move on a hold or hike.
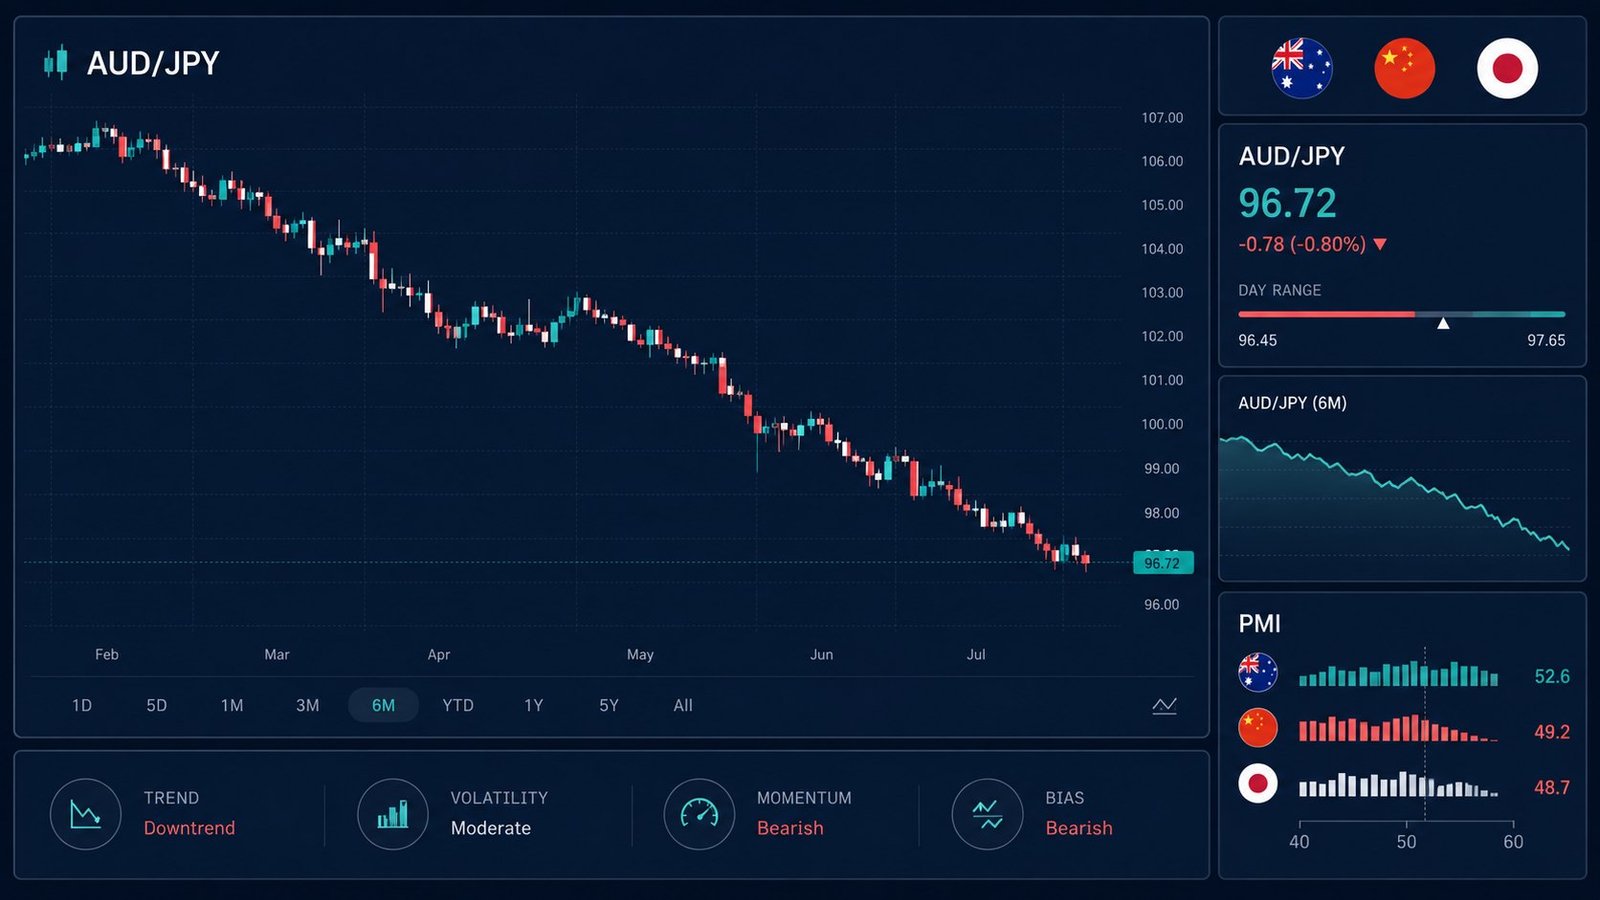
Forex News: AUD/JPY Slides as China PMI Beats
Forex news: AUD/JPY falls as China's Services PMI tops forecasts and Japan's PMI marks a 17-month expansion streak. Here's what it means for your trades.