EUR/USD forecast vs spot is a horizon test, not a trade signal. FX Bank Forecast recorded spot at 1.1392 on September 23, 2026, against a 30-firm December target of 1.1684: 292 pips higher, a reported 2.50% gap. Exchange Rates UK later showed 1.1393 spot versus 1.1598 Q4 consensus, 205 pips or 1.80% higher.
The useful question is not which target sounds more confident. It is whether the target horizon overlaps your decision horizon. Bank panels describe a quarterly endpoint. PRISM measures the next 48 hours with testable open, high, low, and close forecasts, re-anchored every 15 minutes.
How large is the EUR/USD forecast vs spot gap?
The current bank consensus vs spot gap is measurable in pips and percentage terms, but it is not a forecast of the path between now and December. FX Bank Forecast gives a 0.0292 difference between 1.1392 and 1.1684. At 0.0001 per pip, that equals 292 pips.
| Measure | Arithmetic | What it shows | Use when |
|---|---|---|---|
| FX Bank Forecast median | 1.1684 − 1.1392 = 0.0292 = 292 pips; 2.50% reported, 2.56% using spot as the denominator | The December 2026 EUR/USD consensus target | Quarterly context |
| Exchange Rates UK Q4 consensus | 1.1598 − 1.1393 = 0.0205 = 205 pips; approximately 1.80% | A separate provider median updated September 27 | Cross-checking the consensus level |
| Exchange Rates UK provider range | 1.2000 − 1.1100 = 0.0900 = 900 pips; 7.76% width | The disagreement across 28 providers | Measuring forecast dispersion |
| FX Bank Forecast panel spread | 1.24 − 1.10 = 0.14 = 1,400 pips | The distance between the highest and lowest of 30 firms | Assessing target uncertainty |
The EUR/USD consensus target is therefore a distribution endpoint, not a candle-level instruction. A large spot-to-target gap can close through a steady move, a late repricing, or a lower target. The published number does not identify which path will occur over the next 48 hours.
Why is a consensus target not a 48-hour entry trigger?
A December target cannot act as a 48-hour entry trigger because the forecast horizon and the trade horizon do not overlap. The precise failure mode is horizon mismatch — using a long-horizon consensus target for a short-horizon decision.
- A quarterly target states where a panel expects EUR/USD to finish later. It does not specify the next candle's open, high, low, or close.
- A 48-hour decision requires a path estimate, not only an endpoint. The same target can coexist with a 300-pip drawdown before recovery.
- Provider dispersion measures disagreement between analysts. It does not measure the probability that spot reaches the median within your payment or trade window.
- The failure mode triggers whenever your payment or trade horizon ends before the consensus horizon begins to resolve.
Use bank data to frame the macro distribution. Do not convert the median into a directional call. PRISM's role is narrower: test whether the next 48 hours show a coherent candle path and whether the observed range remains inside the projected bounds.
How does PRISM test the next 48 hours?
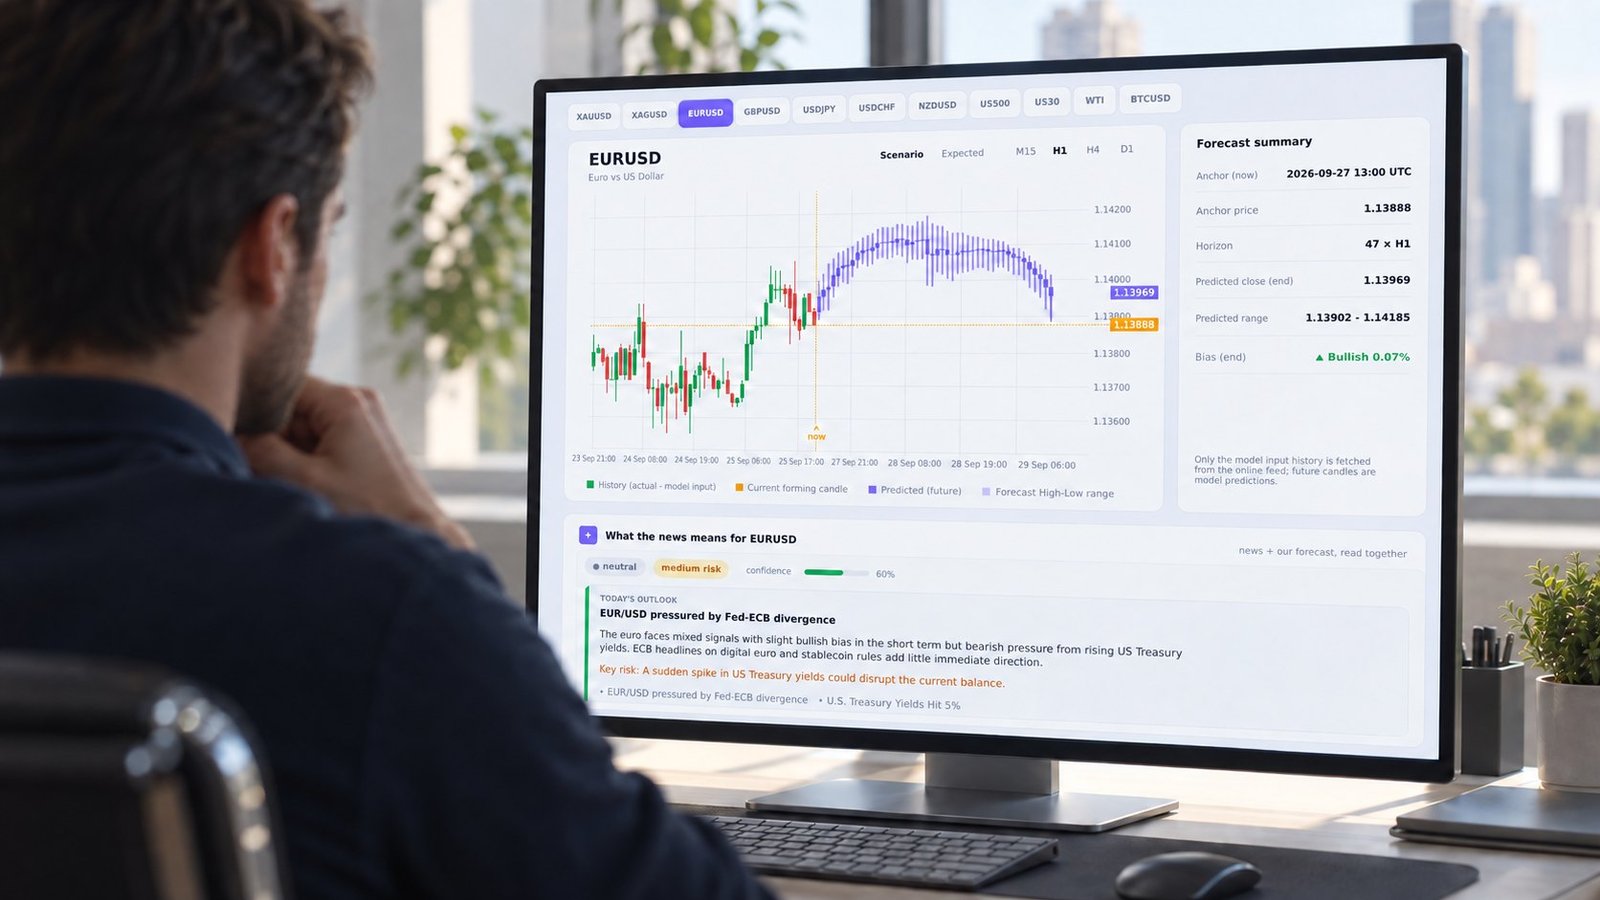
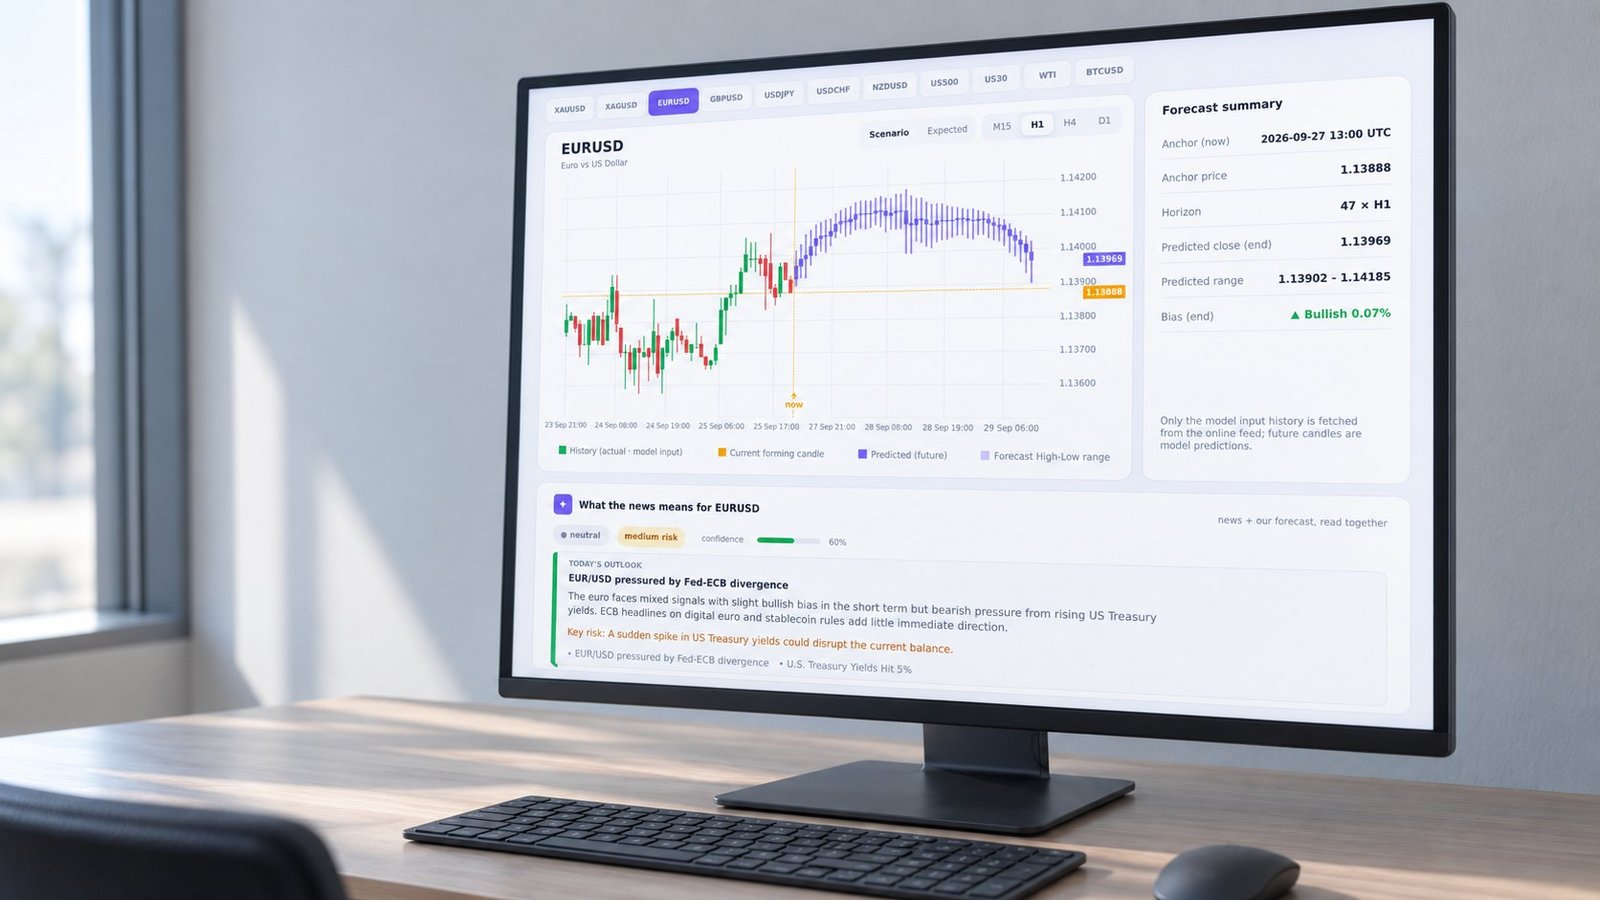
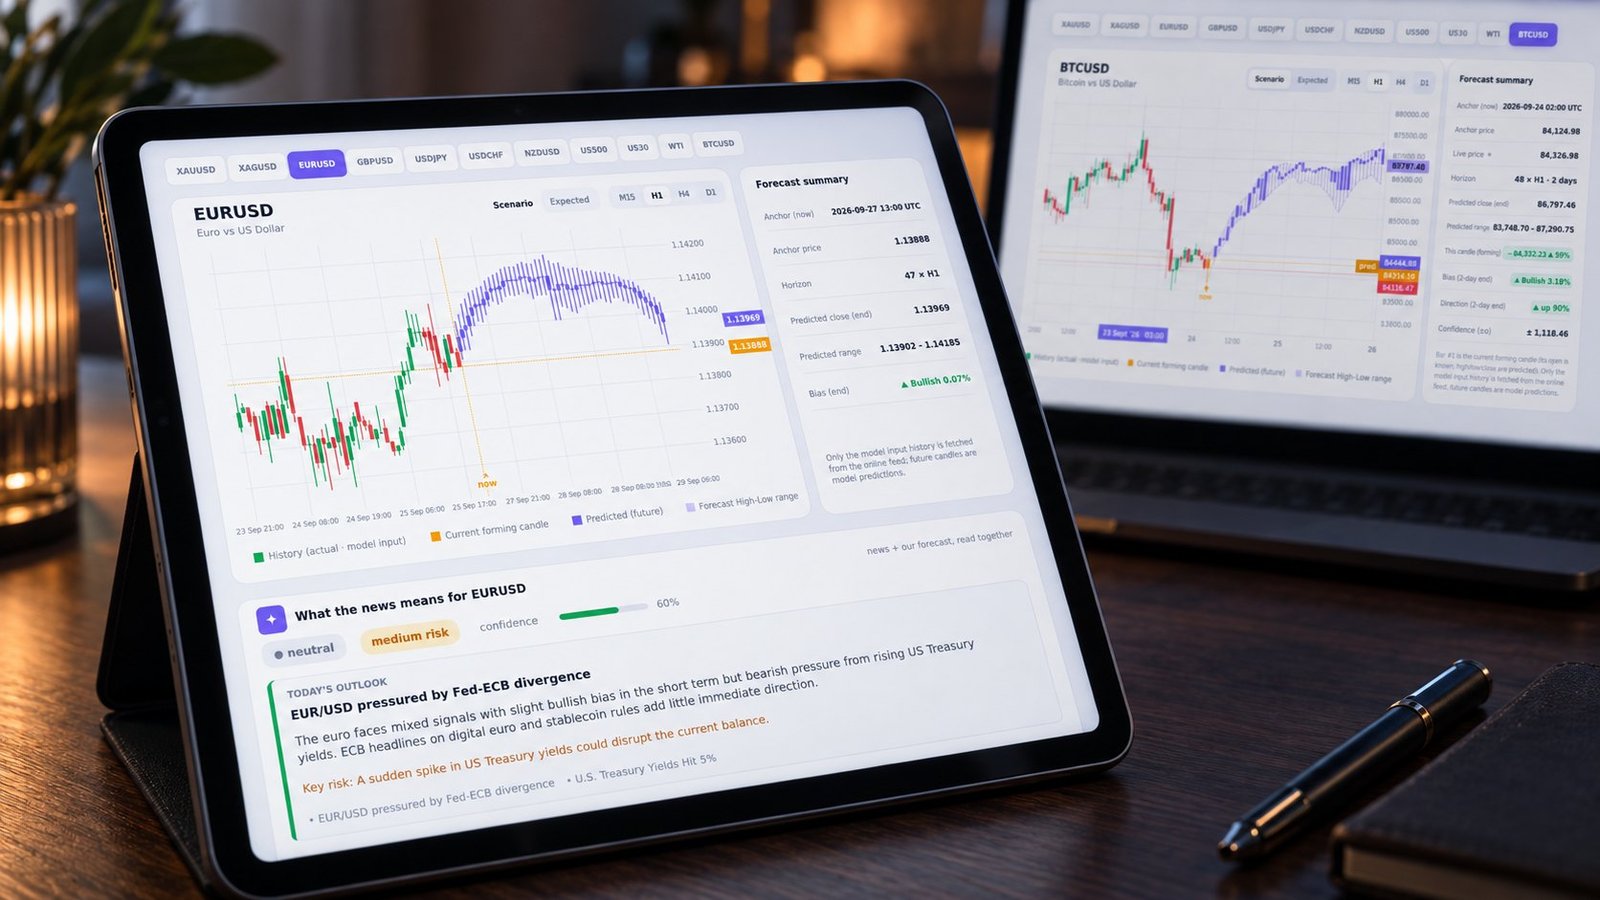
PRISM produces 48-hour OHLC candle forecasts across M15, H1, H4, and D1. Each view is re-anchored every 15 minutes, so your comparison starts from a current reference rather than a stale quarterly snapshot.
- M15, H1, H4, and D1 show the same forecast window at different candle resolutions.
- Each forecast includes projected open, high, low, and close values rather than only a terminal price.
- The model history is separated from the future path, with a forecast high-low range showing expected uncertainty.
- An hourly AI briefing reads current news against each forecast, so macro headlines are compared with the modeled path rather than treated as an isolated trade reason.
- The product covers 11 markets and also exposes the forecast through an MT5 indicator and a REST API.
What should a resolved PRISM log row prove?
A resolved PRISM example should compare one forecast record with the candle that actually printed. The required fields are a UTC timestamp, forecast O/H/L/C, realized O/H/L/C, close-direction result, high/low containment, MAE in pips, and sample size n.
The supplied source pack includes a live EUR/USD screen but no resolved PRISM log row with those measurements. To preserve data integrity, this draft does not invent a timestamp, OHLC values, MAE, or sample size. Insert the actual resolved row before publication using this format: UTC timestamp — forecast O/H/L/C — realized O/H/L/C — direction correct or incorrect — high/low contained or not contained — MAE: [x] pips — n: [sample size].
MAE should be defined before comparing results. For a candle-level record, calculate the average absolute error across the four forecast fields in price units, then divide by 0.0001 to report pips. High/low containment is a separate binary check: both realized extremes must remain inside the forecast interval.
FAQ: EUR/USD forecast vs spot
What is the EUR/USD consensus target?
FX Bank Forecast reports a 30-firm December 2026 median of 1.1684. Exchange Rates UK reports a Q4 consensus of 1.1598 from 28 providers.
How many pips separate spot and consensus?
The FX Bank Forecast comparison is 292 pips from 1.1392 to 1.1684. The Exchange Rates UK comparison is 205 pips from 1.1393 to 1.1598.
When does horizon mismatch fail?
Horizon mismatch fails when a long-horizon target is used for a payment or trade decision that ends before that target horizon overlaps the decision.
What is the practical conclusion?
Treat the bank target as quarterly context and the PRISM output as a short-horizon measurement. Compare the spot-to-target gap, forecast dispersion, projected OHLC path, and realized containment separately. Forecasts are model output, not financial advice, and they do not remove uncertainty. Review the live EUR/USD forecast versus spot view before making your own decision →