Gold ETF holdings vs flows answers two different questions: holdings show how many tonnes funds hold, while flows show net US dollars entering or leaving them. For a 48-hour gold forecast, holdings are the cleaner physical-demand measure; flows add investor-activity context, and AUM must be separated because price changes can move it without new buying.
The operational test is timing. Ranking pages explain correlation, but they rarely show how to align delayed ETF releases with a forecast that re-anchors every 15 minutes and evaluates 48-hour OHLC outcomes. PRISM treats ETF data as slow context, not as a directional label.
How should you measure gold ETF holdings vs flows?
Gold ETF holdings measure the change in physical metal held, in tonnes. Fund flows measure net money entering or leaving funds, in US dollars. AUM measures the value of the fund assets, so it combines holdings with the metal price and is not a pure demand signal.
| Signal | Unit | What it answers | Use when |
|---|---|---|---|
| Holdings | Tonnes | Did the quantity of physical gold held change? | You need the cleanest demand measure. |
| Fund flows | US dollars | How much net cash entered or left the funds? | You want investor-activity context. |
| AUM | US dollars | What is the marked value of the fund assets? | You need scale, not a standalone demand signal. |
The World Gold Council defines gold ETF demand as the change in holdings during a period. Its fund-flow measure records money put into or retrieved from funds. That distinction matters because a fund can show higher AUM after a price rise even when its tonnage is unchanged or lower.
Searches for gold ETF demand tonnes usually refer to the holdings series. The phrase ETF holdings versus fund flows describes the comparison you should make before assigning meaning to a monthly chart. Gold ETF flow data is useful, but it is not interchangeable with metal demand.
What does the historical evidence say about AUM and demand?
The World Gold Council’s August example shows why all three measures belong in separate columns. It reported US$18 billion of inflows, holdings rising 121 tonnes to 4,189 tonnes, and AUM increasing 16% to US$615 billion.
That case shows agreement between cash flow, tonnage, and asset value. It does not make AUM a demand proxy. If gold rises while holdings fall, AUM can still increase.
Why can price and holdings diverge?
HSBC’s Multi Asset Insights February 2026 describes roughly 60% correlation between gold price and ETF holdings through 2023. HSBC also notes that gold later rose nearly 100% while ETF holdings fell roughly 12%. Price momentum and ETF demand can therefore separate for long periods.
Use that result as a warning against reading a rising price chart as proof of fresh ETF accumulation. The divergence is a named failure mode: price-driven AUM expansion can conceal falling tonnage.
What caveats apply to daily holdings data?
WatchGold’s daily global holdings series needs operational adjustments before comparison. Expense-ratio bleed can reduce metal per share, custodians can revise reported balances, and creations or redemptions can change holdings without matching a simple price move.
WatchGold also uses the conversion of 32,150.7 troy ounces per tonne. Keep that conversion fixed when you reconcile ounces, tonnes, and fund-level reports. A small unit error can look like a demand shock.
How do you align ETF publication lag with a 48-hour forecast?
Align the ETF observation timestamp with the forecast anchor, then freeze the ETF input until a new release arrives. The World Gold Council says weekly data updates on the following Monday, while monthly data is usually available within one week of month-end.
- Record the ETF data timestamp, not only the month label. Failure mode — treating month-end as the publication time and giving the model information it could not have seen.
- Record the PRISM anchor timestamp and price. Failure mode — using a later forecast revision to explain an earlier market move.
- Map the same ETF observation across M15, H1, H4, and D1. Failure mode — treating a monthly holdings change as if it were an H1 impulse.
- Score the forecast against future OHLC after each horizon closes. Failure mode — calling a forecast correct because the close entered the band while the observed high or low breached it.
- Keep the ETF variable contextual unless the release is fresh and the price response confirms it. Failure mode — converting a slow macro input into an automatic long or short label.
For the surrounding macro read, pair the measurement test with Gold price forecast 2026. Yield-sensitive moves belong beside How Real Yields Affect Gold in PRISM Forecasts, while the same publication-lag discipline applies when comparing commodity context with an oil prices forecast.
What does an archived PRISM XAUUSD test look like?
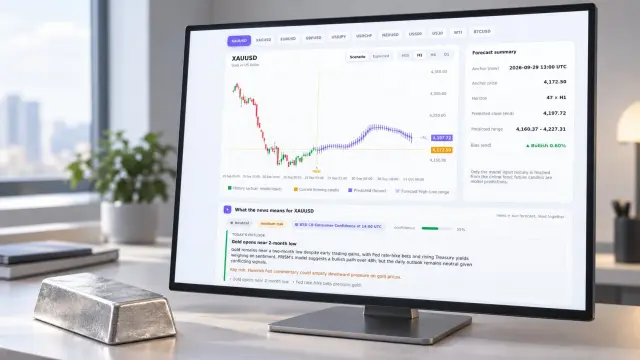
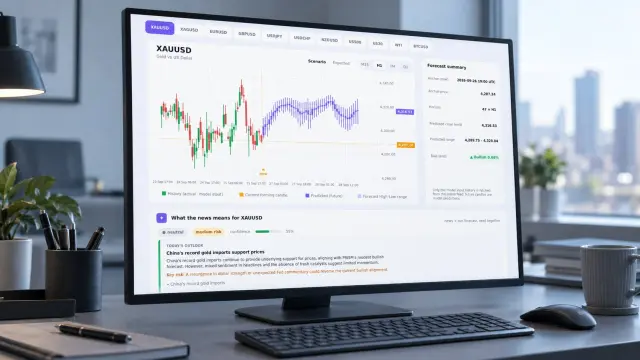
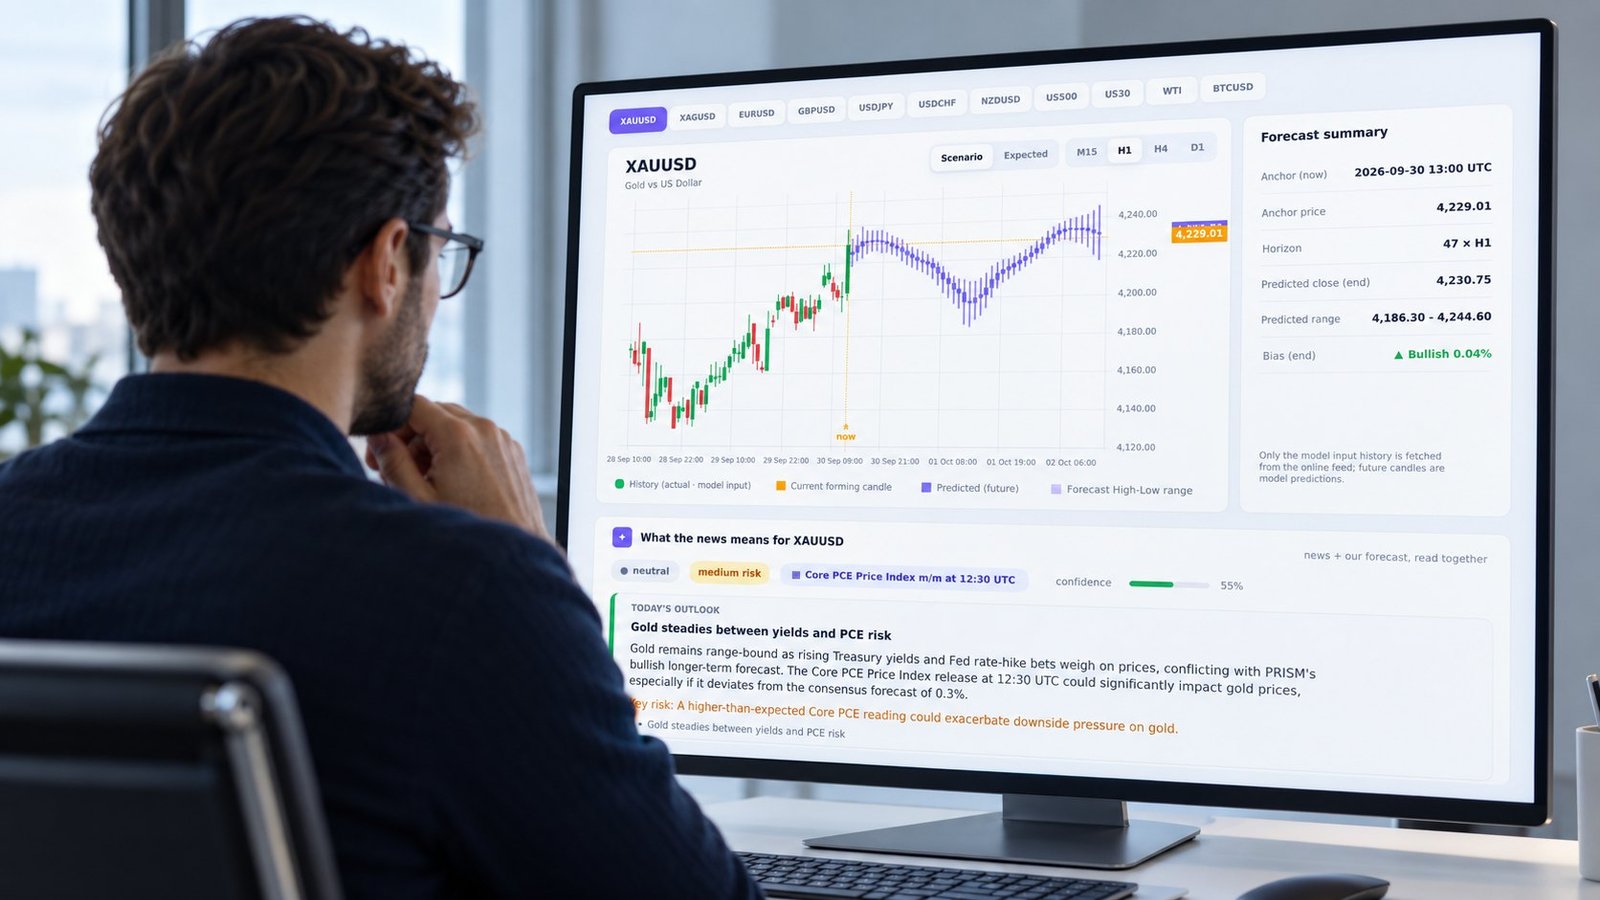
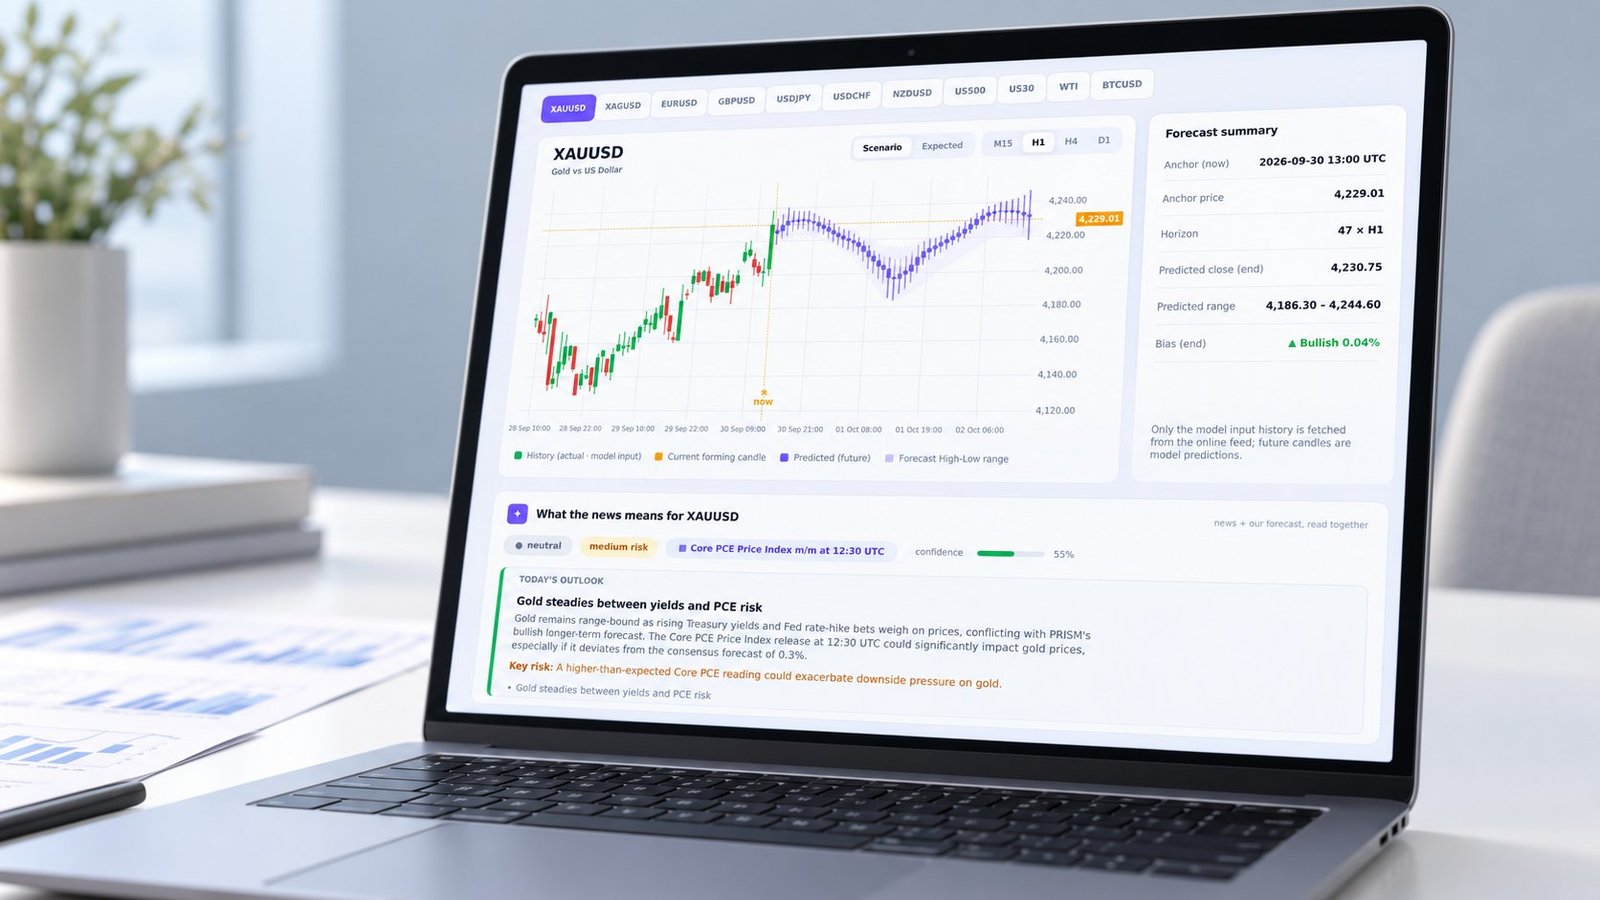
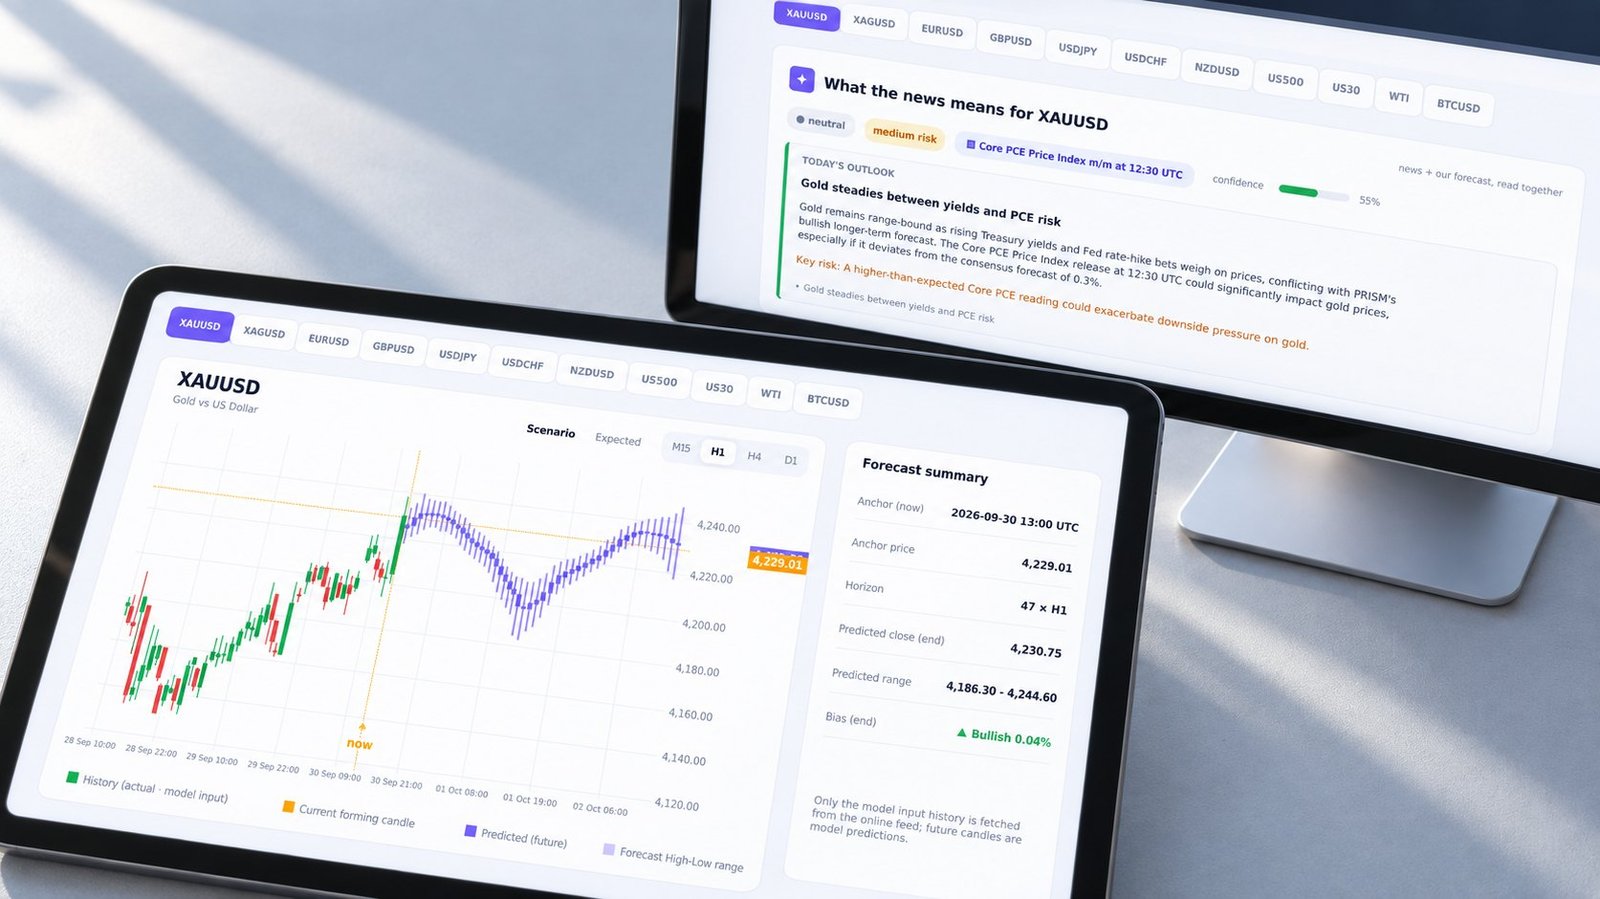
An archived PRISM test pairs the ETF observation with a fixed re-anchor and then checks four forecast horizons. In the supplied example, the World Gold Council ETF data is marked as of 25 September 2026, while the PRISM XAUUSD anchor is 2026-09-30 13:00 UTC at 4,229.01.
PRISM re-anchors every 15 minutes. The product exposes M15, H1, H4, and D1 horizons. For each horizon, record forecast open, high, low, and close, then compare them with the realized OHLC candle after that horizon ends.
The supplied H1 screen shows a predicted close of 4,230.75 and a forecast range of 4,186.30–4,244.60. Those are validated displayed outputs from the screen. The supplied record contains no post-horizon OHLC log, so it does not support a claimed range-containment percentage or hit rate.
That limitation is part of the measurement result. You can verify the input timestamp, re-anchor, four horizon controls, and displayed OHLC range. You cannot infer forecast accuracy until the matching future candle has closed and the log records whether its high and low stayed inside the band.
For model mechanics and candle-level evaluation, Gold Price Forecast AI: Test the Candle, Not the Label is the next relevant comparison. The test is containment and calibration, not whether an ETF headline sounded bullish.
FAQ: How should you use ETF flow data with forecasts?
Are gold ETF flows the same as gold demand?
No. Flows are net US dollars entering or leaving funds. Demand, in the World Gold Council’s framework, is the change in physical gold holdings measured in tonnes.
Is AUM a reliable short-term demand signal?
No. AUM changes with holdings and the gold price. A price increase can lift AUM while holdings decline.
Should ETF data set the direction of an H1 forecast?
No. ETF data is slower context. Use the publication timestamp, preserve the 15-minute forecast anchor, and judge the H1 result against future OHLC.
Conclusion: use ETF data as context, not a signal
Gold ETF holdings vs flows becomes useful when you keep tonnes, dollars, and AUM separate, preserve the release lag, and test the forecast against realized OHLC. PRISM’s hourly AI briefing reads market news against each forecast and shows its direction, risk, and flagged levels for members without replacing the candle test. Review the live XAUUSD forecast and its four horizons on the PRISM live forecast dashboard →