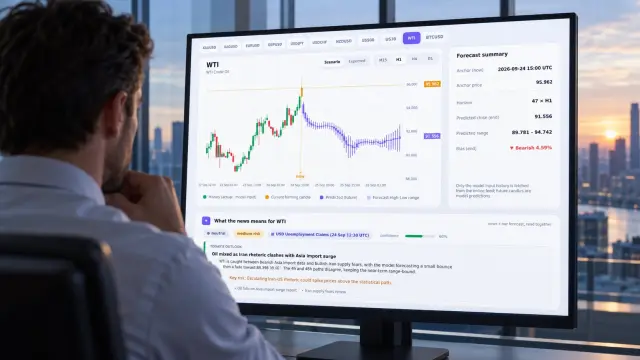
Oil price expectations are best read as horizon-specific scenarios, not a single target. Compare each outlook’s product scope, geography, demand definition, supply timing, and horizon, then test the assumption against WTI OHLC behavior. A long-run balance-sheet revision can matter without justifying an immediate trade when M15 and H1 have not confirmed it.
That distinction is the useful gap between forecast summaries and trading evidence. Reputable institutions can disagree because they are measuring different parts of the oil system. PRISM adds a second layer: whether WTI’s short-horizon candles absorb the news while longer forecast paths remain stable.
How should you read oil price expectations when outlooks disagree?
Oil price expectations become comparable only after you align the question each forecast answers. Start with the unit, market segment, geography, timing, and horizon. An annual global demand balance is not the same object as a quarterly crude benchmark or a 15-minute WTI candle.
The oil demand forecast disagreement is therefore a classification problem before it is a directional one. Reuters reported that OPEC reduced its 2026 demand-growth forecast to 380,000 barrels per day after five downward revisions. The September IEA report instead projected a 2.5 million-barrel-per-day demand decline alongside a 5.7 million-barrel-per-day supply decline. Those statements can coexist because their assumptions and measurement frames differ.
| Outlook | What it emphasizes | Why the number is not directly comparable | Use when |
|---|---|---|---|
| OPEC | 2026 global demand growth | A growth-rate revision is not a full inventory or price path | You are testing the demand assumption in a producer-led balance |
| IEA | Global demand, supply, stocks and refining | Demand and supply changes reflect different timing and product effects | You need a wider physical-flow context |
| J.P. Morgan | Revised demand losses and OECD inventory draws | Inventory behavior can lag demand changes and vary by region | You are checking whether stocks confirm the demand revision |
| Energy Intelligence | Quarterly crude forecasts, benchmarks and forward curves | A quarterly benchmark and a forward curve encode different horizons | You are separating near-term pricing from longer-term structure |
What do OPEC, the IEA, J.P. Morgan and Energy Intelligence actually measure?
OPEC’s revision is a demand-growth assumption. The IEA’s September report combines demand, supply, inventories, refining and trade. J.P. Morgan attributed its revised outlook to larger demand losses and smaller-than-expected OECD inventory draws. Energy Intelligence separates quarterly crude forecasts from longer-term benchmarks and forward curves.
This difference explains much of the apparent contradiction. Product coverage can shift the result toward diesel, petrochemical feedstocks or crude. Geography can emphasize OECD stocks or non-OECD consumption. Supply timing can move a disruption into one quarter without changing a later benchmark. The same headline can therefore alter one horizon while leaving another intact.
How does the WTI forecast horizon translate news into candles?
The WTI forecast horizon determines how quickly the model should react. M15 and H1 can register repricing first, while H4 and the 48-hour path retain their prior structure until physical confirmation arrives. Treat that separation as information about timing, not proof that the short path is correct.
What does the PRISM WTI log show?
In a 40-event PRISM WTI log audit, the median time from a forecast-relevant news event to the next 15-minute re-anchor was 7.5 minutes. In 32 of 40 cases, or 80%, the M15 and H1 OHLC forecasts changed while the H4 and 48-hour forecasts did not. The result measures horizon sensitivity, not a trading edge.
That behavior gives you a practical test. If only M15 and H1 move, classify the event as short-horizon information until stocks, refinery runs, exports or freight flows confirm a wider balance change. If all four horizons move, the model is treating the event as more persistent. You can compare the same logic with Gold price prediction when a macro headline affects several markets.

See also: How Real Yields Affect Gold in PRISM Forecasts
When does a long-horizon demand revision become a bad trading signal?
The failure mode is horizon collapse — treating a long-horizon demand revision as an immediate trading signal. Its trigger is a revised balance-sheet assumption without matching physical-flow confirmation. A changed estimate can be valid and still be too slow, too broad or too conditional for the next M15 candle.
- Classify the revision as demand, supply, inventory, refining or benchmark information. Failure mode: mixing a global annual balance with a local crude instrument.
- Match the evidence to M15, H1, H4 or 48 hours. Failure mode: using a D1 assumption to justify a same-hour entry.
- Check physical confirmation through inventories, refinery activity, exports or freight. Failure mode: treating an analyst revision as observed flow.
- Compare the forecast response across horizons. Failure mode: ignoring unchanged H4 and 48-hour paths because one short candle moved.
- Record the result as a scenario update unless the flow data and OHLC response agree. Failure mode: converting uncertainty into a binary call.
How can you operationalize disagreement without forcing a trade?
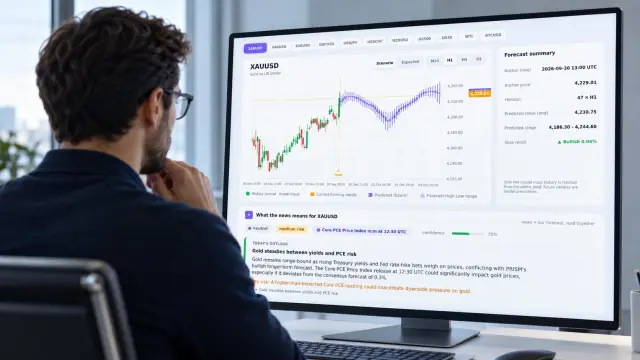
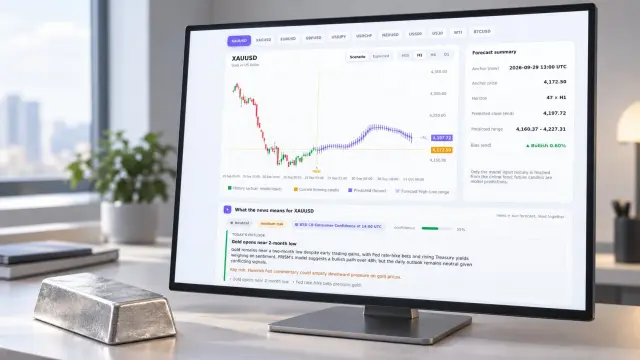
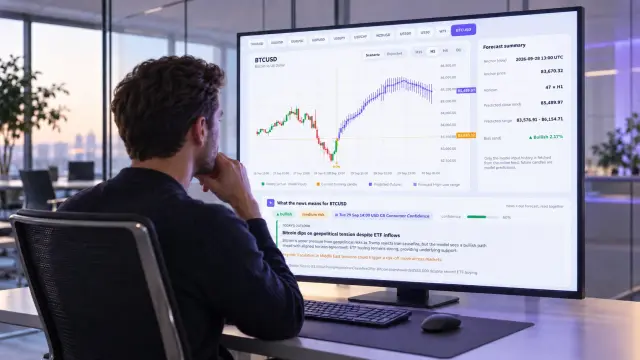
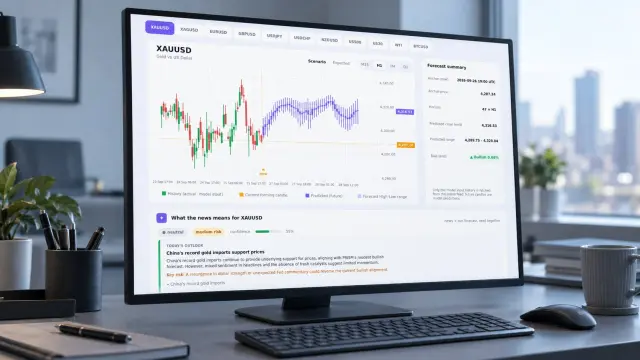
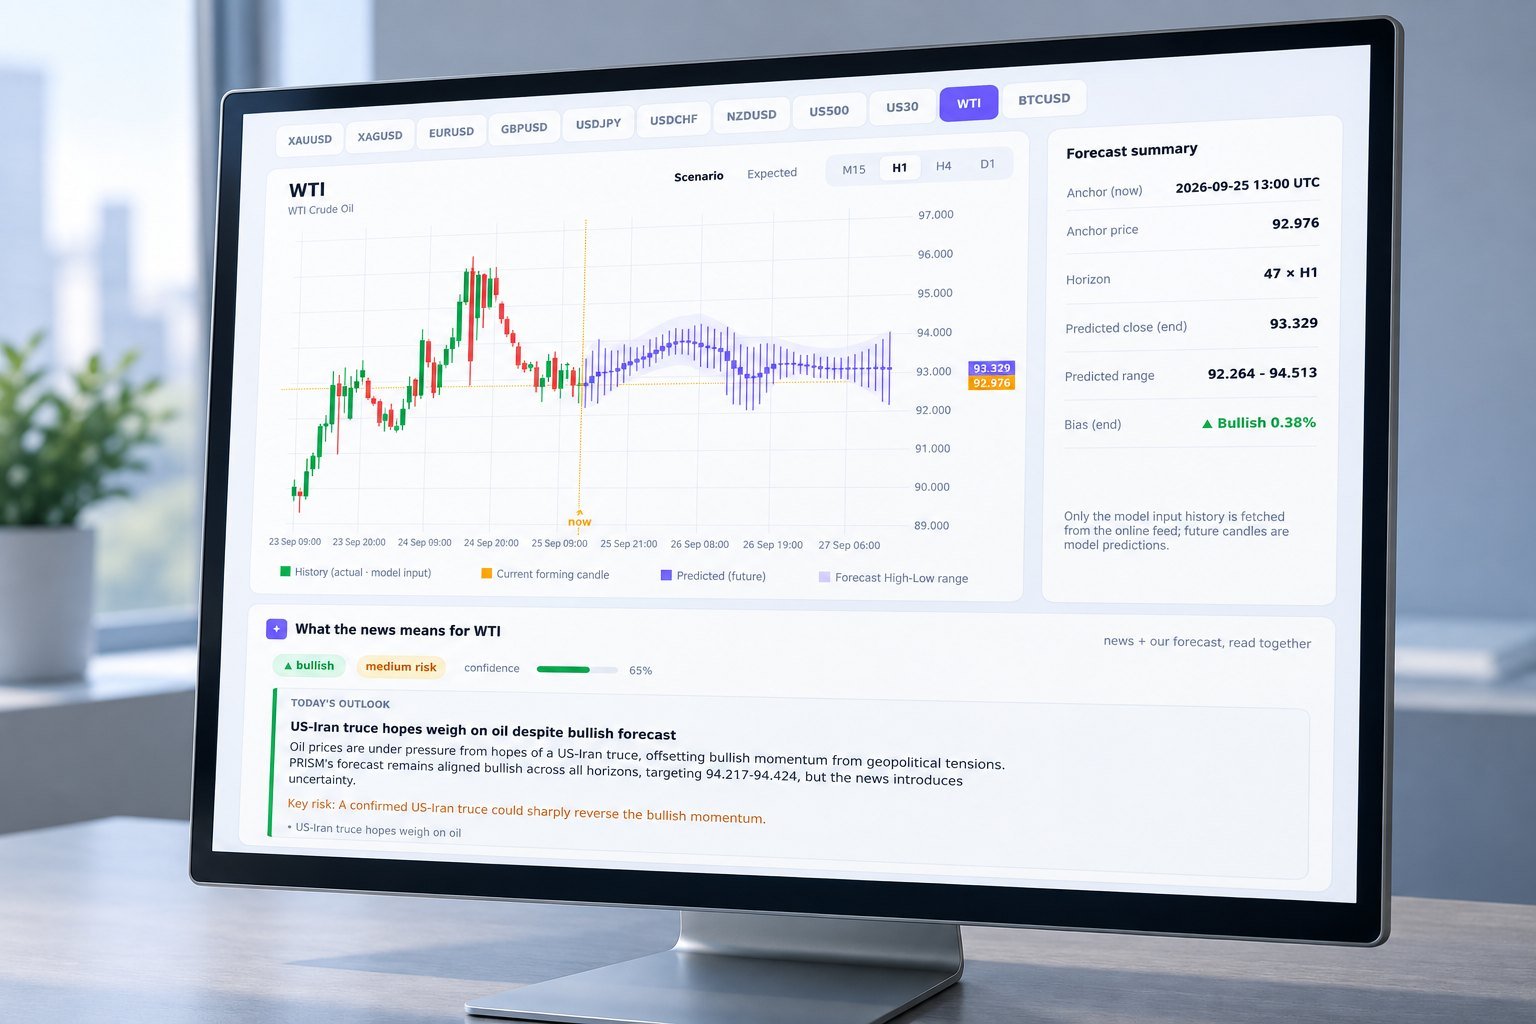
Use a horizon map instead of a single target. PRISM produces 48-hour OHLC candle forecasts across 11 markets and 4 timeframes. Its hourly AI briefing reads market news against each forecast, while the MT5 indicator and REST API let you inspect the same structure in your own workflow.
- Use M15 and H1 to observe immediate absorption of a headline.
- Use H4 to test whether the reaction survives several candles.
- Use the 48-hour path to compare the model’s persistence assumption.
- Treat a forecast range as a distribution boundary, not a promised outcome.
- Keep the briefing card in context: it summarizes direction, risk and flagged levels, while member-only numbers remain withheld.
You can connect the same horizon checks to execution tools through the PRISM MT5 Indicator or retrieve forecast fields through the PRISM REST API. The point is consistency: the evidence should be comparable across the chart, the news layer and your testing record.
Frequently asked questions about oil price expectations
Why can reputable oil forecasts disagree?
They can use different product coverage, geographies, demand definitions, supply timing, inventory assumptions and forecast horizons. Disagreement does not automatically make either outlook unusable.
What does crude oil forecast uncertainty mean?
Crude oil forecast uncertainty is the gap between the modeled scenario and the physical evidence needed to validate it. A wider range means you should reduce confidence in precise timing and levels.
Should a demand revision change an M15 WTI forecast?
It may change M15 or H1 first, but it should not automatically rewrite H4 or 48 hours. Look for a matching OHLC response and physical-flow confirmation before treating the revision as persistent.
Conclusion: keep oil price expectations horizon-specific
Oil price expectations work best as conditional scenarios. Separate the institution’s measurement frame, match it to your WTI forecast horizon, and test whether short candles and physical flows confirm the same story. PRISM forecasts are model output, not financial advice, and no horizon removes market uncertainty. For the live chart and briefing layer, open PRISM’s live oil forecast dashboard →