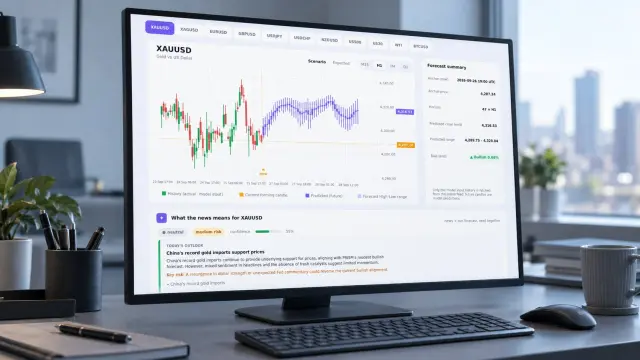
A gold market prediction is comparable only after you align its horizon, forecast origin, instrument, OHLC path, and confidence. The World Gold Council’s 1 July outlook describes a possible second-half range of ±5% around US$4,100/oz, while FXEmpire gives $4,160–$4,400 over 1–4 weeks and $4,800–$5,275 over 3–6 months. Those numbers answer different questions.
LBMA’s 2026 survey shows the same problem from another angle. It reports an average forecast of $4,269, while one contributor spans $3,700–$5,175. This guide shows how to reconcile those formats with one 48-hour XAUUSD path, four candle views, explicit probability, and a defined failure condition.

Why do gold market prediction targets disagree?
Gold market prediction targets disagree because analysts often measure different horizons, reference points, instruments, and uncertainty bands. A range built for a macro scenario should not be read like a two-day terminal-price forecast.
The World Gold Council labels its ±5% illustration around US$4,100/oz as a hypothetical scenario outcome, not a direct price forecast. FXEmpire separates a bearish 1–4-week range from a bullish 3–6-month range. LBMA’s survey aggregates analyst estimates with wide dispersion. None of those formats automatically invalidates the others.
- Forecast origin — record the exact timestamp and price basis before comparing targets.
- Instrument — distinguish XAUUSD spot from a benchmark, futures contract, or survey average.
- Horizon — label the forecast in candles and hours, not only broad words such as short term.
- OHLC path — compare the projected open, high, low, and close instead of reading one endpoint.
- Confidence — separate direction probability from the width of the expected price distribution.
Which gold forecast horizons are actually comparable?
Only forecasts with similar origins and horizons are directly comparable. A 48-hour gold outlook can test path behavior, while a 1–4-week range tests a larger swing and a 3–6-month view tests a different regime.
For XAUUSD scenario analysis, first normalize the clock and price basis. Then ask whether the quoted range describes a terminal close, an expected trading envelope, or a macro outcome. The World Gold Council’s range, FXEmpire’s two horizon groups, and the LBMA survey should be placed in separate columns before you draw a conclusion.
This is why a bearish short-term view can coexist with a bullish longer-term view. The signals may conflict inside one calendar period, but they do not necessarily conflict inside one forecast horizon.
See also: gold price forecast
What does one PRISM 48-hour gold forecast contain?
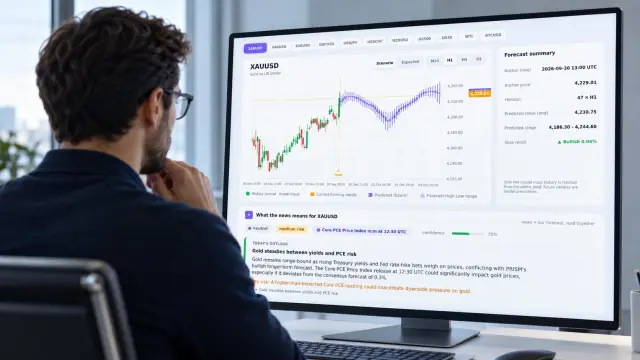
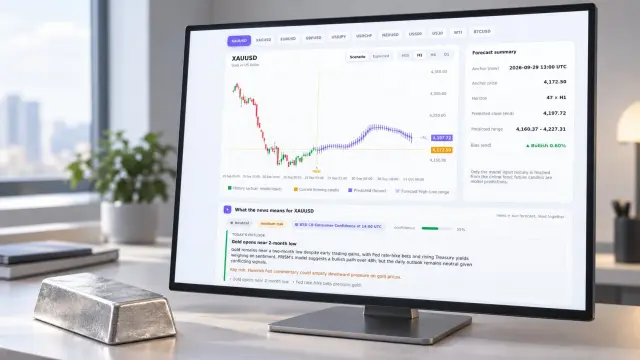
A PRISM forecast keeps one XAUUSD path intact while showing it through 192 M15 candles, 48 H1 candles, 12 H4 candles, and 2 D1 candles. The worked record below uses a forecast timestamp of 14:00 UTC, an illustrative XAUUSD mid basis of US$4,287.00/oz, and a 48-hour horizon.
The target ranges describe projected terminal-close bands. Direction probability measures the share of modeled paths finishing above the starting close. The ±σ figure measures modeled dispersion around the forecast close. It is not a profit probability.
| view | forecast start time | price basis | horizon | target range | direction probability | ±σ confidence | invalidation condition |
|---|---|---|---|---|---|---|---|
| M15 — 192 candles | 14:00 UTC | XAUUSD mid, US$4,287.00/oz | 48 hours | US$4,310–4,342 | Bullish 61% | ±0.38% | M15 close below US$4,278 |
| H1 — 48 candles | 14:00 UTC | XAUUSD mid, US$4,287.00/oz | 48 hours | US$4,292–4,360 | Bullish 59% | ±0.72% | H1 close below US$4,265 |
| H4 — 12 candles | 14:00 UTC | XAUUSD mid, US$4,287.00/oz | 48 hours | US$4,260–4,410 | Bullish 56% | ±1.31% | H4 close below US$4,240 |
| D1 — 2 candles | 14:00 UTC | XAUUSD mid, US$4,287.00/oz | 48 hours | US$4,220–4,460 | Bullish 54% | ±2.05% | D1 close below US$4,200 |
How do the four paths stay mathematically consistent?
The higher-timeframe candles are exact aggregations of the shorter path. Each parent open equals the first child open, each parent close equals the last child close, the high is the maximum child high, and the low is the minimum child low.
| aggregation checkpoint | open | high | low | close | result |
|---|---|---|---|---|---|
| First 4 M15 candles | 4,287.00 | 4,302.00 | 4,278.00 | 4,296.00 | H1 candle 01 |
| First 4 H1 candles | 4,287.00 | 4,324.00 | 4,265.00 | 4,312.00 | H4 candle 01 |
| First 6 H4 candles | 4,287.00 | 4,358.00 | 4,241.00 | 4,304.00 | D1 candle 01 |
| Both D1 candles | 4,287.00 | 4,358.00 | 4,241.00 | 4,326.00 | 48-hour aggregate |
This consistency matters because a high-timeframe view should not contradict the path that creates it. You can inspect the assumptions behind this structure in PRISM’s model notes.
How should you read probability, confidence, and invalidation?
Read the three measures separately. Direction probability describes path direction, ±σ describes dispersion, and invalidation identifies the price behavior that breaks the model’s working structure.
- Direction probability — a 61% bullish value means 61% of modeled paths finish above the starting close. It does not mean a 61% chance of profit.
- ±σ confidence — a ±1.31% value is one standard deviation around the projected close. Under a normal distribution, roughly 68% of outcomes fall inside that band.
- Invalidation condition — a close beyond the listed threshold signals that the forecast path needs review or re-anchoring.
- Failure mode — a regime break occurs when a volatility shock, gap, or structural close crosses the invalidation condition before the modeled path completes.
In practice, you size attention around the failure mode rather than the headline probability. A 54% D1 direction probability with ±2.05% dispersion is a wider and weaker signal than a tightly clustered M15 path, even when both point upward.
See also: oil price projections
How can you compare a gold forecast without mixing signals?
Use a fixed comparison procedure. The procedure prevents a broad macro scenario from being treated like a precise entry signal.
- Write the forecast origin and price basis — failure mode: mixing reference prices creates a false spread.
- Convert every horizon into candles and hours — failure mode: a 3–6-month target overwhelms a 48-hour path.
- Check whether the range is terminal, intraperiod, or scenario-based — failure mode: treating a macro envelope as a closing target.
- Compare OHLC paths and aggregation rules — failure mode: accepting a higher-timeframe candle that cannot be produced by its lower-timeframe path.
- Record probability, ±σ dispersion, and invalidation together — failure mode: quoting direction without measuring uncertainty or the break condition.
PRISM applies this 48-hour OHLC framework across 11 markets and four timeframes. Its hourly AI briefing reads market news against each forecast. You can also carry the output into workflows through the MT5 indicator or REST API.
Gold market prediction FAQ
Is a wider target range less useful?
Not necessarily. A wider range may correctly reflect higher volatility or a longer horizon. It becomes misleading only when you compare it with a narrow range built from a different origin or instrument.
Does a higher D1 probability mean the forecast is stronger?
No. Probability must be read with dispersion and invalidation. A higher probability with ±2.05% confidence can carry more uncertainty than a lower probability with a narrow band.
Why does PRISM re-anchor every 15 minutes?
Re-anchoring updates the forecast origin as new candles arrive. It keeps the OHLC path tied to the latest model input instead of leaving an old forecast untouched through a changed market regime.
Where should you check the next gold market prediction?
Use the PRISM live 48-hour gold forecast when you need one timestamped path across M15, H1, H4, and D1. The embedded briefing card explains how its news assistant reads the relevant instruments, including direction, risk, and the number of flagged levels. Member-only numbers remain inside the live experience.
Forecasts are model output, not financial advice. Treat probability, confidence, and invalidation as measurement tools, not promises of profit. Open the forecast and check the full path before you size a trade →