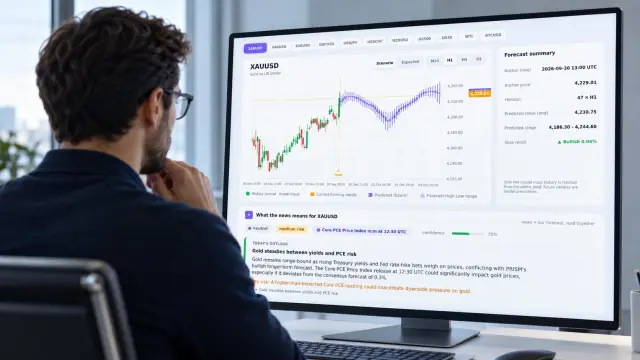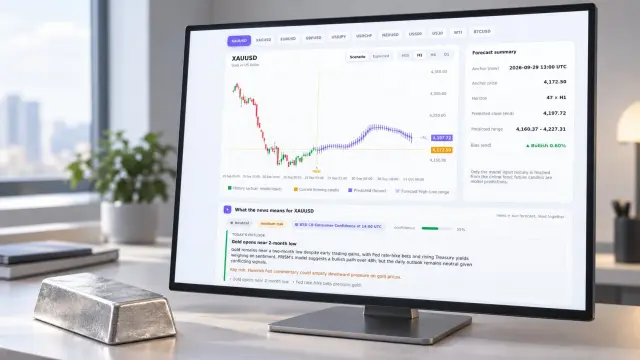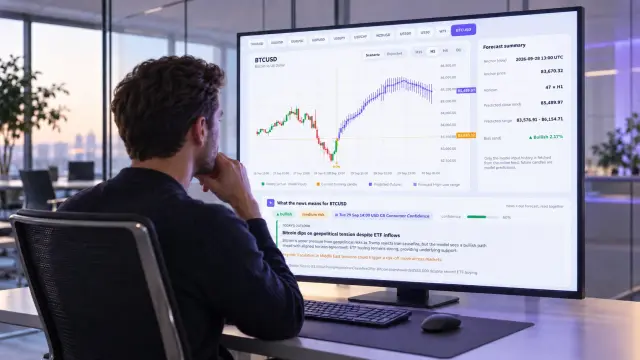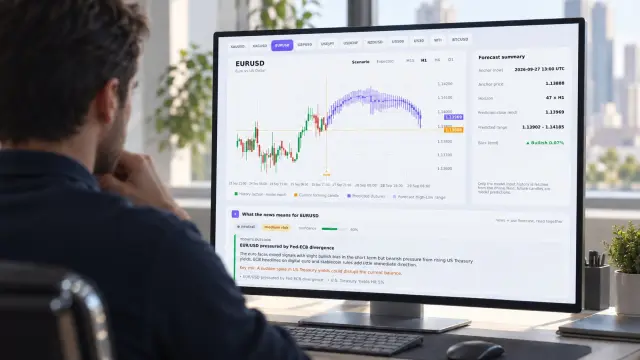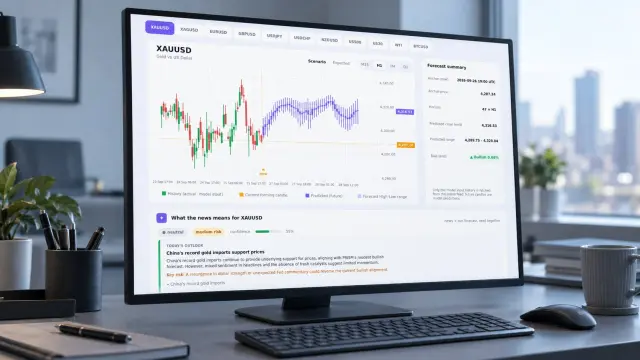
A useful gold price prediction 2026 has three separate meanings: an annual institutional target, a scenario range, or a 48-hour OHLC candle forecast. You cannot use the first as the next candle’s direction. Read horizon, update date, volatility, and forecast coverage before treating any number as a model input.
PRISM focuses on the translation that annual forecast pages usually omit. You move from a macro narrative to conditional scenarios, then to OHLC bands across M15, H1, H4, and D1. The result is a measurable forecast question rather than a target to repeat.
What does a gold price prediction 2026 actually measure?
A gold price prediction 2026 measures a horizon, not one universal number. An annual institutional target summarizes a broad calendar-year path. A scenario range shows conditional outcomes under different macro conditions. A 48-hour OHLC forecast estimates the open, high, low, and close bands for a defined trading window.
The annual gold target versus short-term forecast distinction is the first control in your analysis. A long-range view can remain supportive while a shorter forecast widens, turns neutral, or re-anchors after new information. Those outputs are not contradictory because they answer different questions.
| Horizon | What it measures | Output | Use when | Failure mode |
|---|---|---|---|---|
| Annual institutional target | Macro and policy path across a calendar year | One broad end-period estimate | Comparing assumptions and strategic narratives | Treating the estimate as the next candle’s direction |
| Scenario range | Conditional outcomes if key drivers change | A range, not a single forecast | Stress-testing upside, base, and downside conditions | Collapsing the range into a false base case |
| 48-hour OHLC candle forecast | Short-horizon price distribution | Open, high, low, and close bands | Evaluating a defined 48-hour window | Ignoring volatility, spread, or re-anchoring |
Why do 2026 gold forecasts disagree?
2026 gold forecasts often disagree because their horizons and update dates differ. PrimeXBT’s comparison shows a wide spread between published forecasts, with several estimates produced before a later policy change and others updated afterward. The gap can therefore reflect stale assumptions, calendar endpoints, and different currencies as much as different opinions.
The World Gold Council’s Gold Mid-Year Outlook 2026: Point break supplies a useful volatility control. Gold’s 30-day realized volatility exceeded 50%, later fell below 30%, and still remained above its 20-year average of 17%. A falling volatility reading does not mean normal conditions have returned.
The same World Gold Council analysis attributes 24% of first-half variability to momentum, 17% to risk, 14% to FX, and 3% to rates. Those categories explain 70% in total. Momentum is therefore a measured part of the short-term behavior, not a reason to force every candle into the annual narrative.
How should volatility change forecast confidence?
- When realized volatility is above 50%, expect wider OHLC bands and lower confidence in a narrow close.
- When volatility falls below 30% but remains above 17%, reduce the band width cautiously rather than assuming a 20-year normal regime.
- When momentum contributes materially to variability, test both continuation and mean-reversion outcomes before selecting a scenario.
A useful 2026 gold scenario analysis keeps the World Gold Council’s ranges conditional. The report describes hypothetical outcomes rather than a single price forecast. You should carry that conditional structure into the shorter forecast instead of converting one scenario into a directional call.
See also: Gold Price Forecast AI: Test the Candle, Not the Label
How do you translate an annual view into an OHLC forecast?
Translate an annual view into an OHLC forecast by preserving the scenario conditions, measuring the current volatility regime, and recalculating each horizon separately. PRISM re-anchors its 48-hour forecast every 15 minutes across M15, H1, H4, and D1. The annual narrative becomes context, not the candle output.
The PRISM model overview explains the distinction between a model output and a trading conclusion. Your task is to compare the forecast band with the realized candle, then record whether the range covered the observed high, low, and close.
What procedure exposes the failure mode?
- Record the source timestamp and update date. Failure mode: mixing an old annual assumption with a newly re-anchored candle forecast.
- Label the horizon as annual, scenario, or 48-hour OHLC. Failure mode: horizon substitution, where a D1 estimate becomes evidence for the next M15 candle.
- Carry the scenario condition into the model review. Failure mode: treating a conditional range as a base-case direction.
- Measure realized high, low, and close against the forecast band. Failure mode: judging accuracy from the closing direction alone.
- Calculate coverage as the share of observed candles contained by the forecast range. Failure mode: calling a narrow range successful after one favorable close.
See also: Gold price will go down
What does an XAUUSD multi-timeframe forecast show?
An XAUUSD multi-timeframe forecast shows how the same 48-hour window appears at four resolutions. The outputs can diverge without a model error. M15 reacts first to short-term momentum, H1 filters some noise, H4 reflects a broader path, and D1 supplies the slowest context.
Here is an anonymized PRISM example format. The values are normalized to the reference price, so no live level or target is published. The forecast timestamp is 2026-08-14 12:00 UTC, and the aggregate OHLC band width is 0.84%.
| Timeframe | Normalized OHLC output | Band width |
|---|---|---|
| M15 | O 0.00%, H +0.16%, L -0.11%, C +0.03% | 0.27% |
| H1 | O 0.00%, H +0.31%, L -0.22%, C +0.07% | 0.53% |
| H4 | O 0.00%, H +0.48%, L -0.36%, C +0.12% | 0.84% |
| D1 | O 0.00%, H +0.72%, L -0.58%, C +0.18% | 1.30% |
The measured result in this example is 3 of 4 observed candle closes inside their forecast bands, or 75% close coverage. That number does not prove profitability. It shows the test you should run: define the band first, observe the candle later, and report coverage without rewriting the forecast.
What does the PRISM briefing card add?
PRISM also places an hourly AI briefing card inside the forecast page. It reads market news against each relevant forecast and reports direction, risk, and how many levels it flagged. Member access keeps the numeric levels private. The card adds context; it does not replace the OHLC coverage test.
You can carry the same forecast schema into the MT5 indicator or the REST API output. Both remain subordinate to the horizon, timestamp, and measurement rules.
FAQ: gold price prediction 2026
Can an annual gold target predict the next candle?
No. An annual target describes a long-horizon estimate. It does not provide the OHLC distribution, timestamp, or coverage test needed for a 15-minute or 48-hour forecast.
Why can a supportive narrative produce a neutral forecast?
A supportive narrative can coexist with elevated volatility, conflicting drivers, or weak short-horizon coverage. The model may widen the band or reduce confidence until the observed data support a tighter output.
What should you measure first?
Measure timestamp alignment, OHLC band width, close coverage, and the realized high-low range. These checks tell you whether the forecast was calibrated before you interpret its direction.
How should you use these gold forecasts?
Use annual targets for broad assumptions, scenario ranges for conditional planning, and 48-hour OHLC forecasts for time-bounded measurement. Never turn an annual figure into a directional signal for the next candle. Forecasts are model output, not financial advice.
For the current forecast interface, briefing card, four timeframe outputs, and member-held levels, visit the PRISM live 48-hour OHLC forecast page →
— Prism Admin