
A bitcoin liquidity forecast remains actionable after a cross-market shock only when the shock’s transmission agrees with the OHLC path and uncertainty band. Compare the three-month Bitcoin cash-and-carry return with the two-year Treasury yield, separate DXY strength from dollar liquidity and Federal Reserve policy, then check whether M15, H1, H4, and D1 still tell a consistent story.
The practical question is not whether dollar liquidity and bitcoin correlate. It is whether the mechanism behind the shock has reached the forecast horizon you are trading. PRISM Forecasting helps with that timing through 48-hour OHLC forecasts, 15-minute re-anchoring, and an hourly briefing that reads news against each forecast.

What does bitcoin liquidity actually measure?
Bitcoin liquidity is the amount and availability of dollar-denominated funding that can support spot, derivatives, and market-making activity. DXY, dollar liquidity, and Fed policy describe different layers, so a shock in one layer cannot be treated as a complete liquidity verdict.
EdgeX separates these variables clearly. DXY measures the dollar against a basket of major currencies. Dollar liquidity concerns the money available in the system. Federal Reserve policy changes the cost and expected path of funding. A bitcoin macro liquidity check should keep those measurements separate.
| Signal | What it measures | Forecast meaning | Use when |
|---|---|---|---|
| DXY strength | The dollar’s exchange value against a major-currency basket | A proxy for cash preference and financial-condition pressure | The shock arrives through foreign exchange or broad risk sentiment |
| Dollar liquidity | Fed balance sheet, reverse-repo usage, and M2 | Funding availability and a slower macro impulse | You are interpreting H4 or D1 context |
| Fed policy | Rates, balance-sheet stance, and forward guidance | The path of borrowing costs and capital flows | A policy decision or guidance change moves Treasury yields |
The distinction matters because liquidity can improve while the dollar strengthens, or the DXY can weaken before broader money measures respond. EdgeX also notes that Bitcoin can diverge from dollar moves because of ETF flows, positioning, regulation, and crypto-specific news.
How does a Treasury shock reach Bitcoin?
Bitcoin reacts to the transmission path, not to a macro label. The first question is whether the return available from crypto financing still compensates desks for supplying positions and market liquidity.
Coinbase’s Weekly: Expensive Patience gives a concrete test. When the annualized return on a three-month Bitcoin cash-and-carry trade falls below the two-year Treasury yield, desks have less incentive to supply financed crypto positions and liquidity. A Treasury repricing can therefore widen market friction and make a forecast band less informative before a clear directional move appears.
FinanceFeeds makes the time-scale distinction useful: global M2 relationships are more informative over longer horizons, while volume shocks can contain shorter-horizon information. That is why a bitcoin liquidity forecast should not force an H1 reaction from a D1 liquidity measure.
When does bitcoin liquidity forecast uncertainty begin?
Treat horizon disagreement as uncertainty when at least two of the four PRISM horizons show opposite endpoint directions and the H1 endpoint sits inside the opposing horizon’s forecast high-low interval. One disagreement is divergence to monitor. That two-part condition is the exact trigger for downgrading alignment.
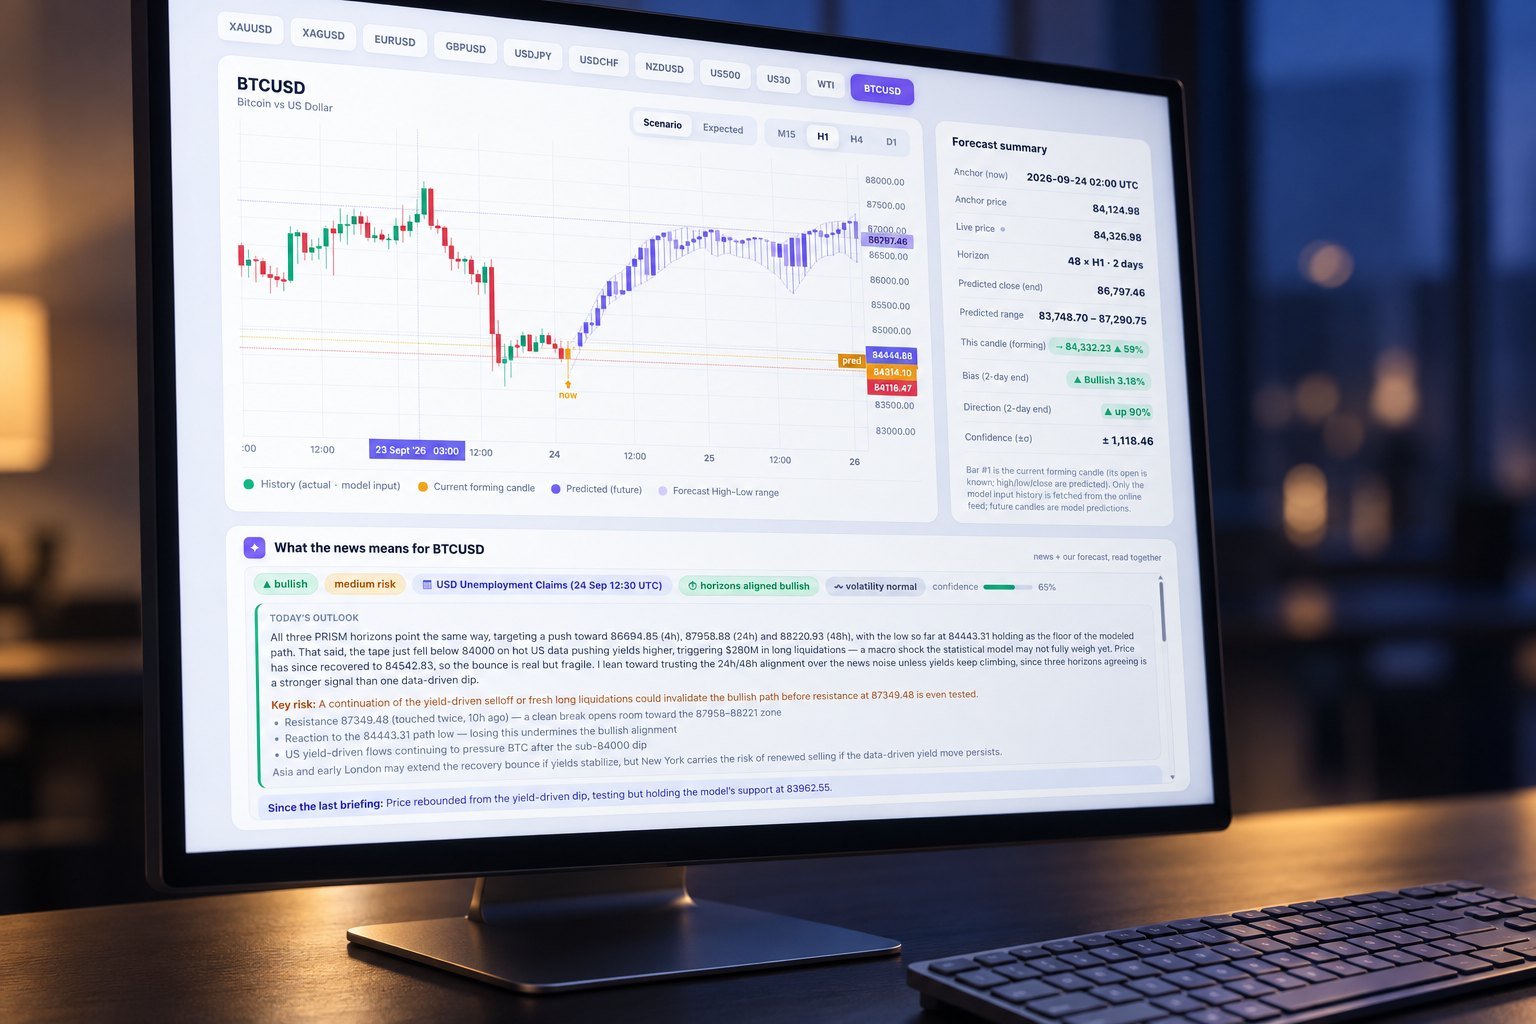
PRISM produces 48-hour OHLC forecasts across 11 markets and four timeframes: M15, H1, H4, and D1. The model re-anchors every 15 minutes, so the question is always whether the new anchor preserves the earlier structure or invalidates it.
In an anonymized example, a 2026-01-14 09:15 UTC H1 forecast had a high-low width of $1,840, equal to 2.21% of the anchor. H1 pointed higher while D1 pointed lower, and the H1 endpoint remained inside the D1 interval. The result was uncertainty, not a directional signal.
- Classify the shock as DXY strength, dollar-liquidity change, or Fed-policy repricing. Failure mode—using the DXY as a complete liquidity measure.
- Compare the three-month cash-and-carry return with the two-year Treasury yield. Failure mode—ignoring a funding incentive that can reduce crypto market supply.
- Check M15, H1, H4, and D1 endpoint directions together. Failure mode—treating one favorable H1 candle as confirmation when longer horizons disagree.
- Re-anchor the reading every 15 minutes and record the forecast range. Failure mode—acting on a stale path after the shock changes the anchor.
How do you validate a 48-hour range after a shock?
A forecast range is useful only if its coverage is measured under known conditions. PRISM’s internal validation should be read as a range test, not as a claim about directional accuracy or future returns.
In one internal validation sample, 2,160 H1 forecast windows from 2025-11-01 through 2026-02-28 covered the realized 48-hour high and low in 91.2% of cases. Coverage counted only when both realized extremes stayed inside the predicted band. It did not count a forecast as successful merely because the closing direction was correct.
The failure mode is false precision. A wider range can improve coverage while reducing decision value. After a liquidity shock, compare the range width with the horizon disagreement trigger, then ask whether the band is narrowing as the model re-anchors.
How should news and forecast horizons be read together?
News should modify your confidence reading, not replace the forecast. PRISM’s hourly AI briefing reads market news against each forecast and reports the relevant direction, risk level, and number of flagged levels; member-only numbers remain withheld from the public card.
Use the briefing to identify a possible failure mode. A Treasury-yield shock can explain a sudden range expansion. A crypto-specific headline can explain why Bitcoin diverges from DXY. The model path and the news interpretation are separate evidence streams that should agree before you treat a short horizon as actionable.
If the shock crosses metals and currencies, the neighboring Gold price prediction shows how the same range-and-horizon discipline transfers to another macro-sensitive market. PRISM also exposes its forecasts through an MT5 indicator and REST API for structured monitoring.
FAQ: Bitcoin liquidity and forecast uncertainty
Is DXY a measure of bitcoin liquidity?
No. DXY measures the dollar’s exchange value against a currency basket. Bitcoin liquidity requires separate evidence from funding conditions, money aggregates, market volume, and policy transmission.
Why can M2 disagree with an H1 forecast?
M2 is a slower measure. FinanceFeeds describes global M2 relationships as more useful over longer horizons, while volume shocks can carry shorter-horizon information. An H1 forecast can therefore react before M2 changes.
What does the forecast range tell you?
The range describes the model’s projected high-low envelope over the selected horizon. It is not a price target. Coverage testing tells you how often realized extremes stayed inside similar historical bands.
How should you act on a bitcoin liquidity shock?
Use the shock to resize confidence, not to manufacture a direction. Keep a short-horizon forecast actionable only while the funding mechanism, horizon alignment, re-anchored path, and measured range behavior agree. Forecasts are model output, not financial advice. Review the bitcoin price USD forecast when you need the latest PRISM horizon structure and news context →