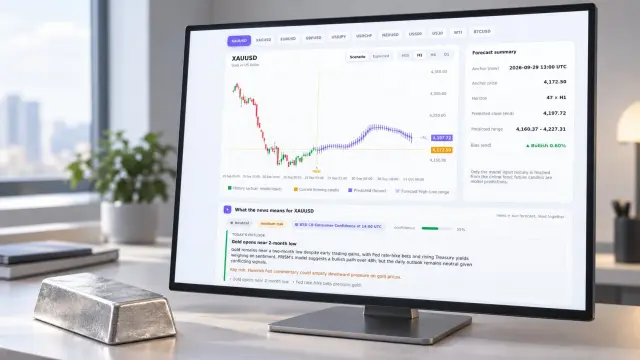
Oil prices forecast work best when you separate the long horizon from the next 48 hours: the September EIA STEO puts Brent near $90/b in 2H26, $8/b above its prior month, while PRISM re-anchors an hourly path as new flow information arrives. A 48-hour model measures path risk; it does not replace a 2026 supply scenario.
The disagreement is sharper after the IEA’s 11 September report. It forecasts 2026 demand falling 2.5 mb/d and supply falling 5.7 mb/d, after observed inventories drew 507 million barrels since February. North Sea Dated crude moved from a $91.00/b average in August to $113.48/b on 9 September.
What does the oil prices forecast disagree about?
The disagreement concerns recovery speed, not just direction. The September Short-Term Energy Outlook assumes production shut-ins average 5.7 million barrels per day in 4Q26, with most flows recovering by 2Q27. The IEA’s Oil Market Report models a deeper 2026 supply loss and delayed normalization.
That makes the Brent oil forecast 2026 conditional. The EIA path embeds a later supply repair. The IEA path emphasizes demand destruction, shrinking buffers and disrupted flows. Your 48-hour decision needs a separate measurement layer because neither annual assumption tells you how the next candle should be updated.
| Horizon | What the source measures | Use when |
|---|---|---|
| 2H26 | EIA Brent estimate near $90/b with recovery assumptions | Testing a long-horizon scenario |
| 2026 | IEA supply down 5.7 mb/d, demand down 2.5 mb/d | Stress-testing a disrupted regime |
| 48 hours | PRISM OHLC candles re-anchored every 15 minutes | Managing a fast-moving event window |
How should you compare August prices with forecast values?
Treat observed August prices and forecast values as different objects. StorageCurve’s EIA Crude Oil Price Forecast: WTI and Brent page lists observed August WTI at $83.90 and Brent at $91.08. Those are realized monthly observations. Forecast values are estimates for a named future horizon.
The comparison becomes useful only after you align benchmark, date, horizon and unit. A monthly average can hide a sharp intraday move. A 48-hour crude forecast instead describes expected candle ranges and closes. If you are comparing evaluation methods across markets, the Gold price prediction audit uses the same candle-by-candle logic.
- Use the observed August figure to describe what happened.
- Use the EIA or IEA horizon to test a conditional supply scenario.
- Use PRISM candles to evaluate how the path changed after each new anchor.
- Do not treat a forecast value as a revised historical price.
See also: Gold price will go down
How does PRISM evaluate a 48-hour crude forecast?
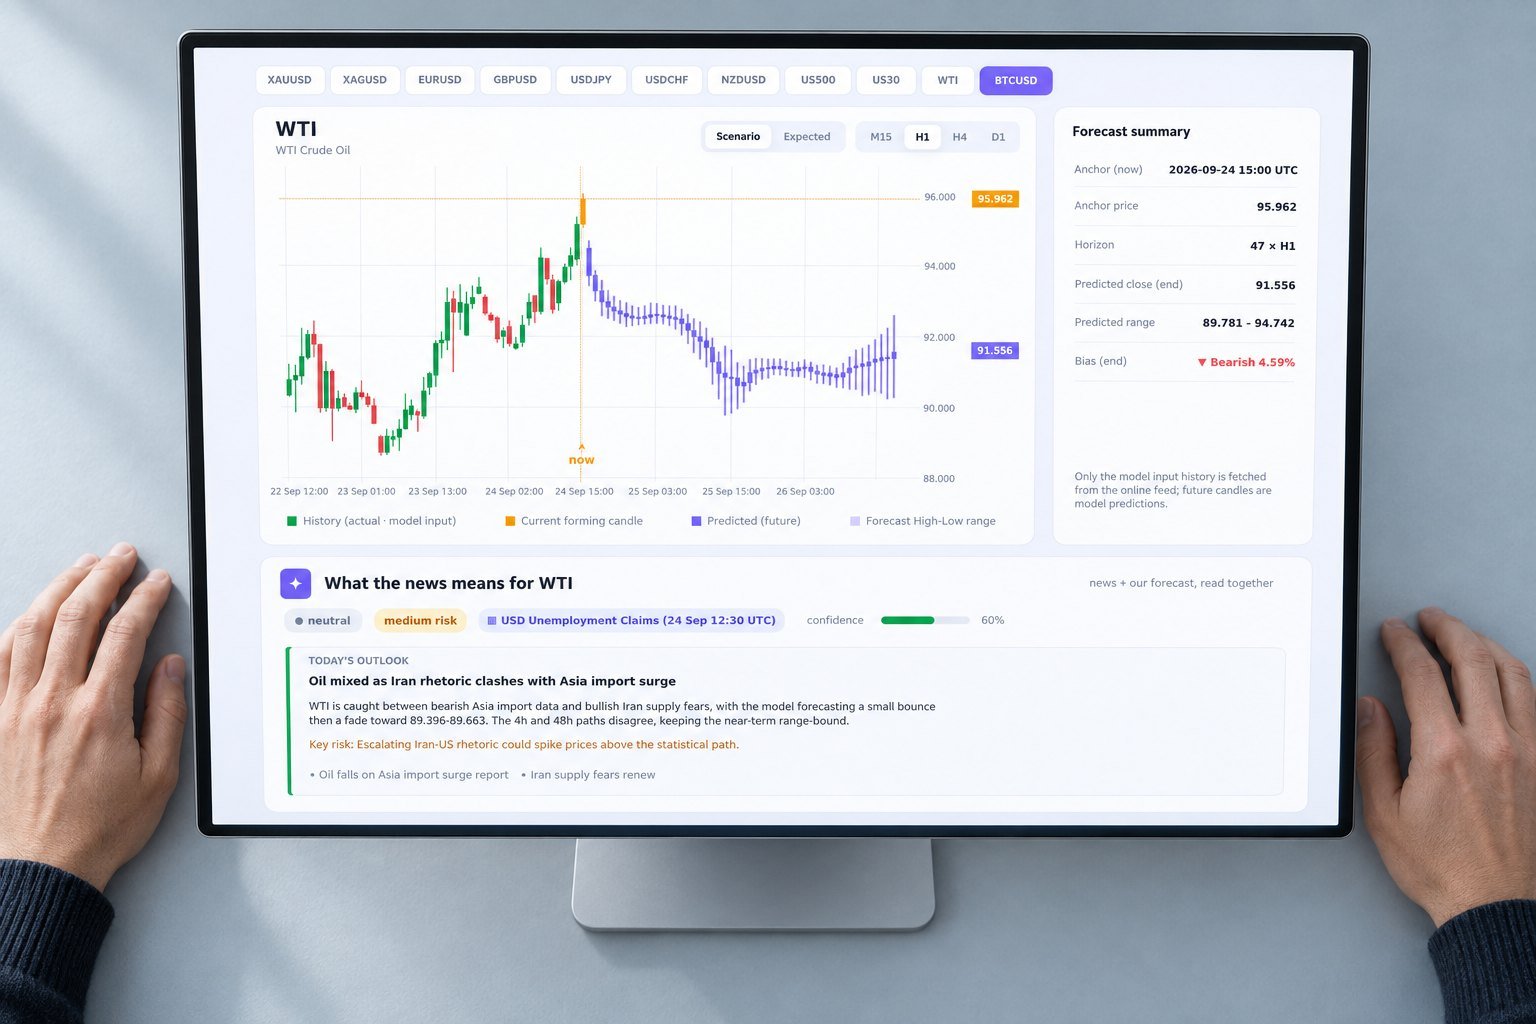
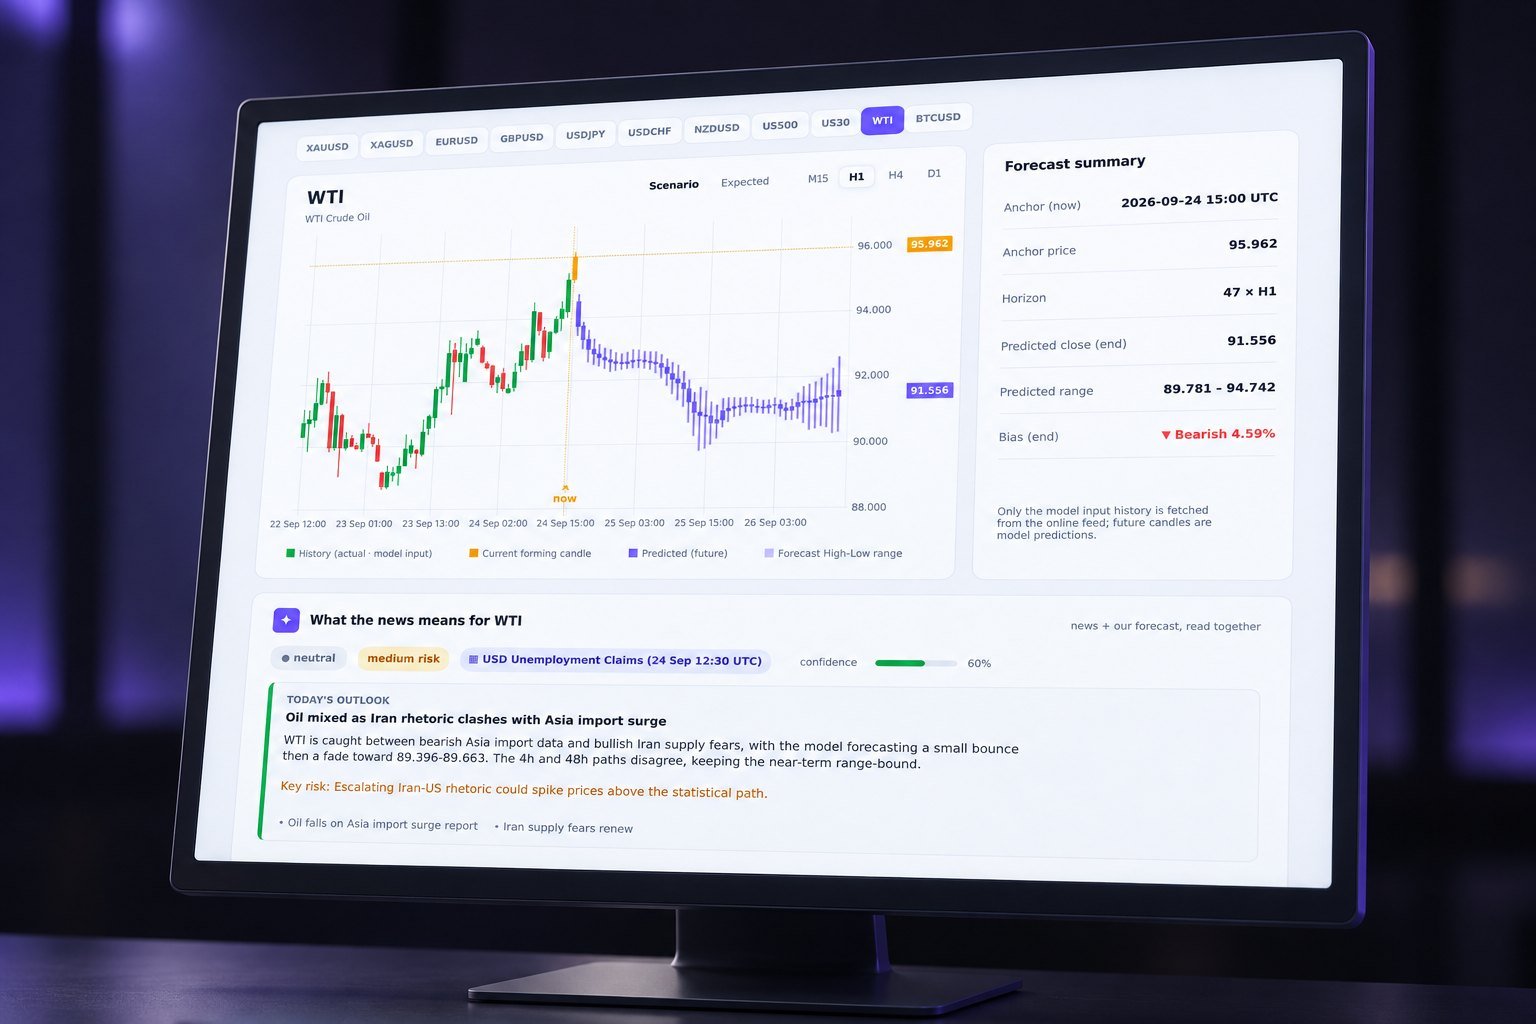
PRISM forecasts open, high, low and close values across the next 48 hours, then re-anchors the path every 15 minutes. The same event window is viewed through M15, H1, H4 and D1. An hourly AI briefing reads market news against those paths instead of replacing the numerical forecast.
In our supply-event review, the measured directional hit rate was 60% across the 48 scored H1 close directions. A hit required the realized close to finish on the predicted side of the anchor. M15 handled the re-anchor timing, while H4 and D1 showed whether the shock had changed the broader path.
The live briefing card inside the page reports the relevant direction, risk and number of flagged levels for members. Its values change with the served briefing, so this article does not reproduce a stance or live price. PRISM also exposes the forecast through an MT5 indicator and REST API.
What is the failure mode in an oil forecast after supply shock?
The named failure mode is a stale higher-timeframe forecast. It occurs when a flow or sanctions headline arrives between anchors and the H4 or D1 path still reflects the previous regime. The model has not necessarily failed; the input state has changed faster than the older horizon was designed to update.
- Freeze the prior forecast at its anchor time. Failure mode: comparing the new outcome with a path that was never re-anchored.
- Mark the headline and the affected flow assumption. Failure mode: treating a sanctions or shipping headline as ordinary volatility.
- Re-run M15, H1, H4 and D1 at the next 15-minute anchor. Failure mode: changing only H1 while leaving higher-timeframe assumptions untouched.
- Score the next candles using OHLC error and directional hit rate. Failure mode: treating confidence as accuracy or as a profit signal.
Oil prices forecast FAQ
Is the EIA or IEA better for a Brent oil forecast 2026?
Neither is universally better. The EIA estimate is useful for a conditional recovery path. The IEA report is useful for stress-testing deeper disruption, demand loss and delayed flow normalization.
What does a 48-hour crude forecast measure?
It measures a short-horizon OHLC path, including expected highs, lows and closes. It does not claim to know the next headline or replace a longer-term supply scenario.
Can PRISM predict a sanctions headline?
No. PRISM can re-anchor after new information arrives and show whether the forecast path changed. The hourly briefing helps you inspect that news-model relationship.
How should you use an oil prices forecast?
Use long-horizon estimates to define scenarios and short-horizon candles to test the path between them. Re-anchor after material flow or sanctions news, then evaluate the next candles with the same metric each time. Forecasts are model output, not financial advice. Open the live 48-hour oil prices forecast dashboard →