How real yields affect gold is best understood through opportunity cost: when inflation-adjusted yields on cash or bonds rise, non-yielding gold faces a relative headwind, but the signal is not automatic. A nominal 4% yield implies a 1% real return with 3% expected inflation and 3% with 1% expected inflation.
The practical question is not whether a rate headline sounds hawkish. It is whether the inflation-adjusted return available from yield-bearing assets changed, whether the dollar moved, and whether your short-horizon forecast agrees. PRISM Admin uses that sequence across 48-hour OHLC forecasts.
How do nominal and real yields affect gold?
Real yields affect gold through the return you can earn elsewhere after expected inflation. Nominal yields show the stated payment, while real yields estimate purchasing-power-adjusted return. The nominal vs real yields distinction is therefore the first filter for any rate-driven gold analysis.
Gold Update gives the clean teaching example: a 4% nominal yield with 3% expected inflation produces roughly a 1% real return. The same 4% nominal yield with 1% expected inflation produces roughly a 3% real return. The second setup raises gold's opportunity cost much more, even though the nominal headline is identical.
For a 10-year TIPS gold comparison, use the 10-year real yield as a reference rather than treating it as a complete model. Gold Update also notes that policy expectations can move currencies, while NYC Bullion emphasizes that shorter maturities become more relevant when near-term policy expectations reprice.
| Yield measure | What it captures | Use when |
|---|---|---|
| Nominal Treasury yield | Stated return before expected inflation | You are measuring the headline surprise |
| Real yield | Estimated return after expected inflation | You are testing gold's opportunity cost |
| Short-maturity real yield | Near-term policy and inflation repricing | The market changes its expected policy path |
| 10-year real yield | Longer-horizon inflation-adjusted return | You need a stable reference for the gold relationship |
How real yields affect gold in a 48-hour PRISM forecast
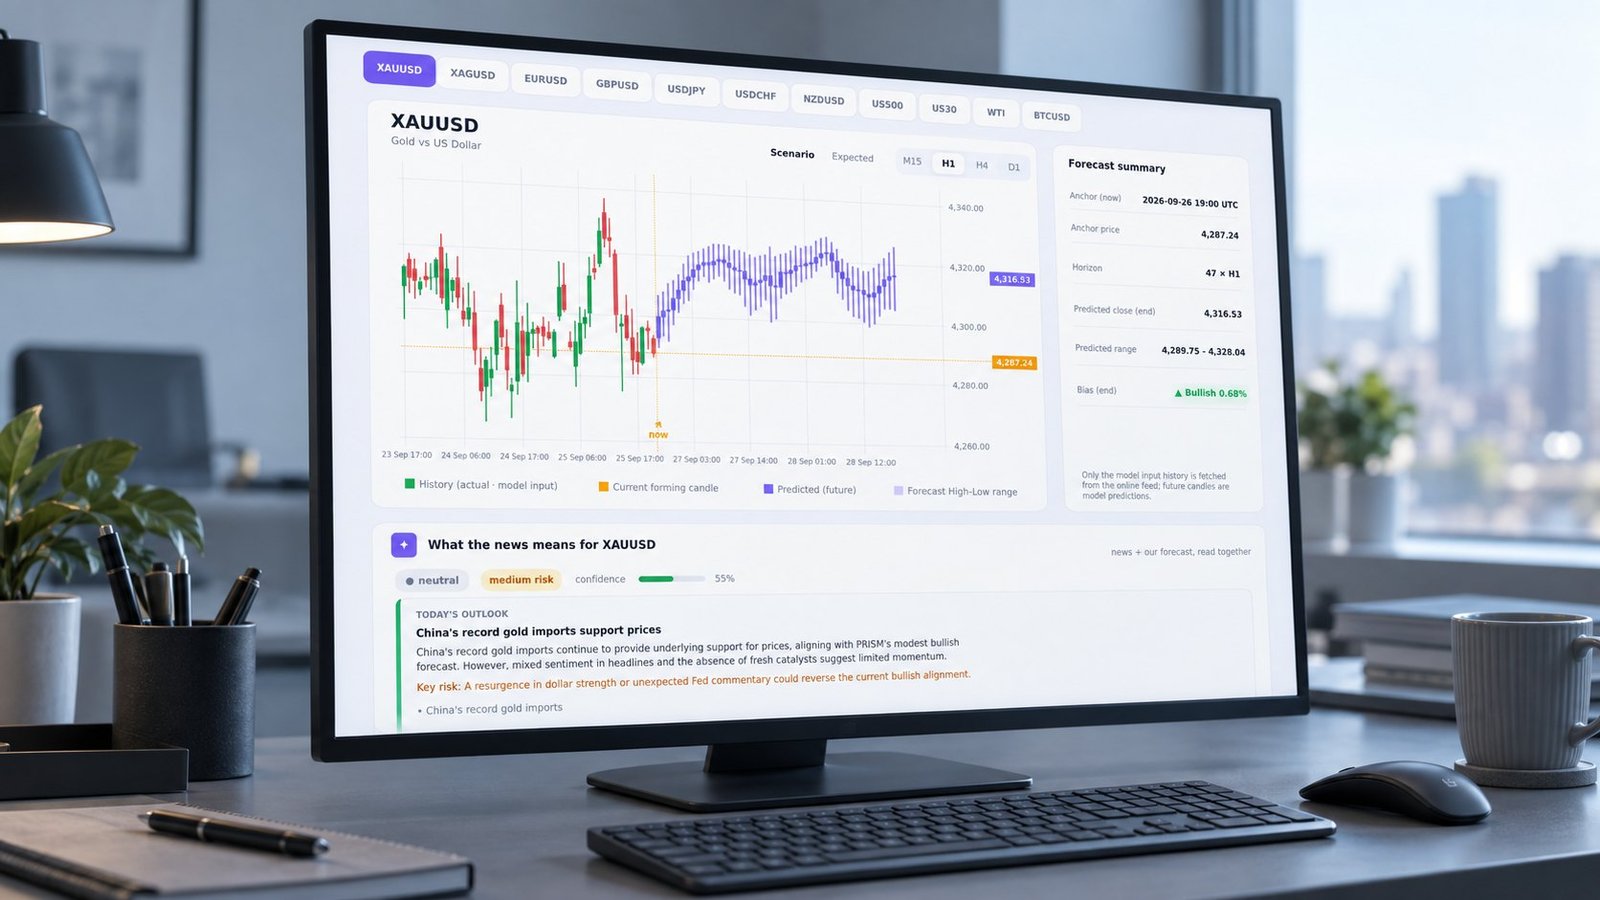
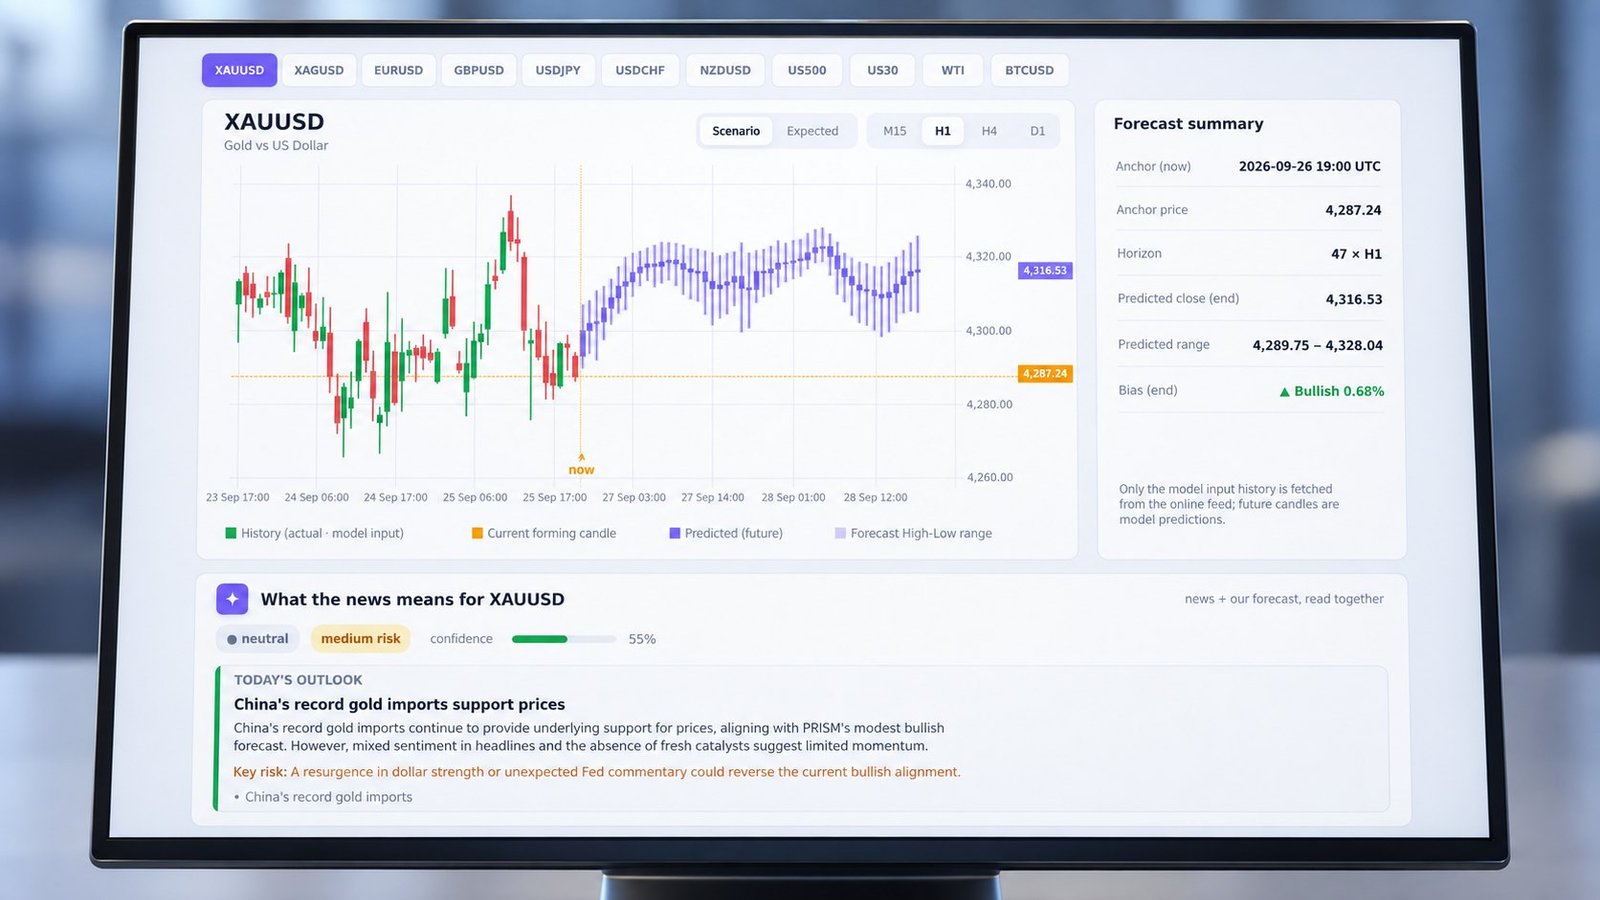
In a PRISM forecast, real-yield analysis is a context layer for the OHLC path, not a directional command. You compare the M15, H1, H4 and D1 scenarios, then check whether the 48-hour high-low bands agree with the rate shock.
The chart re-anchors every 15 minutes. That matters because the first candle after a yield move can show an incomplete response. The hourly AI briefing card adds news interpretation to the forecast, including direction, risk and flagged levels, while member-only values remain inside the served card.
When you need to separate a model path from a label, use Gold Price Forecast AI: Test the Candle, Not the Label. The useful test is whether the forecast range, close projection and timeframe alignment respond coherently.

An anonymized replay with a UTC anchor
Use an anonymized replay to make the measurement explicit. At the 2026-05-19 14:00 UTC anchor, the 48-hour projected band ran from 3,038.20 to 3,094.80. Its width was 1.86%, calculated against the lower band. The realized high was 3,101.40, the realized low was 3,029.60, and the realized close was 3,082.70. These replay values are not live levels.
What does it mean when gold and real yields rise together?
Gold and real yields rising together is a trigger to question the simple inverse relationship. It can indicate that currency effects, risk aversion, official-sector demand, positioning or an inflation shock are outweighing opportunity cost.
The Central Bank of Malta study, GOLD PRICES AND SOVEREIGN BOND YIELDS IN 2025-Q1 2026, tests the relationship with correlation, OLS and quantile regression. Its result is regime-dependent co-movement rather than one permanent rule. That is why a nominal-yield headline cannot automatically tell you that Gold price will go down.
The failure mode is treating a nominal-yield headline as an automatic directional signal. The specific trigger is a move where gold and real yields rise together. When that happens, pause the headline interpretation and inspect the dollar, expected inflation, forecast bands and timeframe disagreement.
How should you read M15, H1, H4 and D1 disagreement?
Read the shortest timeframe as the fastest reaction and the longer timeframes as slower regime tests. Agreement across M15, H1, H4 and D1 is stronger evidence than one dramatic candle, but disagreement is information rather than an error.
- Start with M15. Measure the first response after the 15-minute re-anchor. Failure mode — treating the initial wick as the full yield shock.
- Check H1. Compare the projected close with the 48-hour band and record direction probability and confidence as percentages. Failure mode — confusing a wide band with high conviction.
- Check H4. Ask whether the hourly move persists across several candles. Failure mode — using a short-lived policy repricing as a multi-session trend.
- Check D1. Use the daily path as a regime check, not as a near-term entry signal. Failure mode — allowing a broad horizon to override a clear short-horizon invalidation.
For a longer horizon, the same discipline applies to gold price prediction 2026: identify the horizon first, then test whether the underlying yield mechanism fits it. PRISM's MT5 indicator and REST API expose the same forecast logic in workflows that need structured output.
FAQ: real yields, gold and forecast signals
What is the difference between nominal and real yields?
A nominal yield is the stated return before expected inflation. A real yield adjusts that return for expected inflation and is usually the more relevant opportunity-cost measure for gold.
Why can gold rise when real yields rise?
Gold can rise when currency moves, risk aversion, central-bank demand or positioning outweighs the pressure from higher real yields. The Central Bank of Malta study shows why the relationship can change by regime.
Which maturity should you watch first?
Use the 10-year real yield as a broad reference. Shift attention toward shorter maturities when policy expectations or near-term inflation assumptions reprice sharply.
How should you use the real-yield signal?
Treat real yields as one measured input to a forecast, not as a standalone call. Separate nominal from inflation-adjusted rates, test whether gold and real yields rise together, and compare M15, H1, H4 and D1 before drawing a conclusion. Open the PRISM 48-hour multi-timeframe forecast to inspect the OHLC paths and briefing layer →