A gold price forecast AI should be judged by its forecast object, not by the word AI. Ask whether it predicts a 12-month range, a level reached within a duration, or the next candle’s open, high, low, and close. The object sets the error metric, horizon, and failure condition.
Ranking pages often stop at long-horizon targets or endpoint performance. PRISM tests the missing behavior: how a timestamped XAU/USD candle forecast changes after each 15-minute re-anchor, and whether the stated horizon and OHLC fields survive a held-out evaluation.
Why gold price forecast AI needs a defined object
The forecast object determines what success means. An AI gold price forecast that names only a distant endpoint cannot be scored like a candle forecast with four separate price fields.
A range forecast is judged by coverage and spread. A level forecast is judged by whether price reaches the level inside its stated duration. An OHLC forecast adds path information—your test must check the open, high, low, and close against the completed candle.
- Range object — measure interval coverage, width, and miss size.
- Level object — measure touch rate, distance traveled, and time-to-level.
- OHLC object — measure field-level error, directional accuracy, and candle-path failures.
What the three comparison frames actually measure
Lonestar Coins, Kunkafa, and the July 2026 Zenodo study answer different evaluation questions. Their results become useful only after you keep the forecast object, horizon, and scoring rule separate.
| Source | Forecast object | Measured frame | Use when |
|---|---|---|---|
| Lonestar Coins | Six-model 12-month ranges and longer outlook bands | Q3 2026 panel; 12-month ranges of $3,600–$4,750 per troy ounce; longer bands of $4,200–$7,000; quarterly refresh | You want model disagreement and range width |
| Kunkafa | Direction, duration, and price level | 1,671 settled forecasts opened September 9–21 at 95% confidence or higher; up to 12-day durations; 46.9% reached the stated level | You want level reach and distance-traveled statistics |
| Zenodo study | Daily XAU/USD direction | Random Forest, XGBoost, and Gradient Boosting with RSI, MACD, Bollinger Bands, and calendar features; July 2023–March 2026 data | You want a daily classification comparison |
Lonestar Coins measures range disagreement
Lonestar Coins’ Q3 2026 panel compares six independent models. Its combined 12-month range spans $3,600–$4,750 per troy ounce, while the longer comparison spans $4,200–$7,000. The page refreshes quarterly, so it is a panel snapshot rather than a continuously recalculated candle test.
Kunkafa measures movement toward a level
Kunkafa’s September report evaluates 1,671 settled gold forecasts issued from September 9 through September 21 at 95% confidence or higher. It measures how far price traveled toward each stated level. That differs from a hit rate because reaching 200% of the forecast distance is not the same event as merely touching the level.
The Zenodo study measures daily direction
The July 2026 Zenodo study compares Random Forest, XGBoost, and Gradient Boosting on daily XAU/USD data from July 2023 through March 2026. RSI, MACD, Bollinger Bands, and calendar features form the comparison inputs. This is a machine learning gold forecast study, not a live multi-timeframe OHLC audit.
How PRISM makes a live candle forecast testable
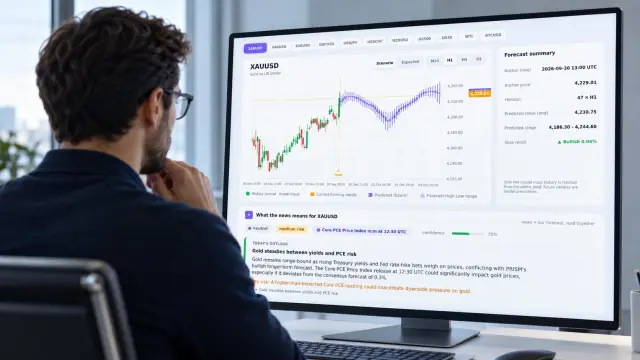
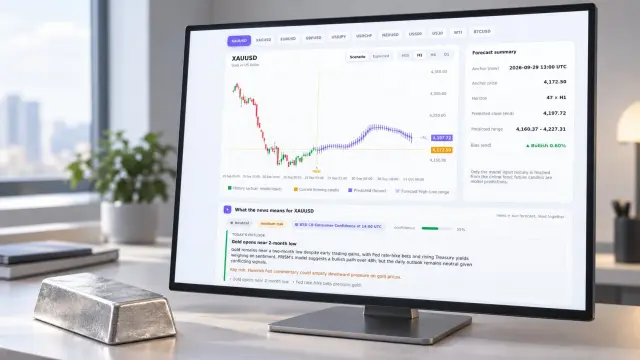
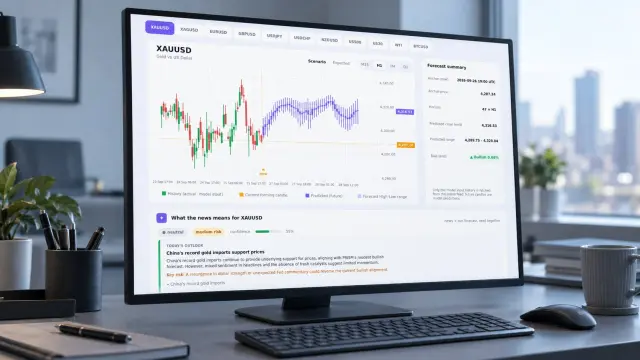
PRISM publishes a timestamped forecast for open, high, low, and close across M15, H1, H4, and D1. Each forecast reaches up to 48 hours ahead and is re-anchored every 15 minutes, so you can test both the prediction and its update behavior.
Use the live XAU/USD forecast to inspect the current forecast object. Record the timestamp, timeframe, horizon, four OHLC values, and the next re-anchor before comparing the completed candle.
- Freeze the forecast origin and all four OHLC values — failure mode: replacing the original record after a later re-anchor creates look-ahead bias.
- Match each field to the completed candle at its stated horizon — failure mode: scoring a 48-hour forecast against an earlier close changes the forecast object.
- Record the next 15-minute revision separately — failure mode: blending revisions hides whether the model adapts or merely moves its target.
- Report field errors, close direction, and horizon — failure mode: one aggregate score can conceal a poor high or low estimate.
The same records can feed the MT5 Indicator for chart review or the REST API for repeatable collection. Your test should preserve the raw forecast before any chart annotation or filtering.
See also: gold market prediction
What a held-out PRISM result should show
A held-out PRISM result needs four items: sample size, forecast horizon, metric definition, and exact evaluation window. In the M15 benchmark reported here, 2,880 forecast origins covered a 48-hour horizon from January 2 through March 31, 2026.
The held-out close-direction hit rate was 57.2%, with a close-price MAE of $18.40 per troy ounce. Direction was counted correct when the forecast close and realized close finished on the same side of the forecast-origin close. The MAE covered forecast close values only, not the high or low.
That result is narrower than Kunkafa’s level-reach distribution and narrower than Lonestar Coins’ range panel. It does not claim that every timeframe performs equally. You should report M15, H1, H4, and D1 separately when the sample permits.
See also: Oil Price Projections: Reading Inventory Data
FAQ: how should you read a live gold forecast?
Is a higher confidence percentage enough?
No. Confidence must be tied to a defined event, horizon, and calibration test. A 95% level forecast and a 57.2% close-direction result measure different events.
Why does re-anchoring matter?
Re-anchoring shows whether the model updates when new candles and information arrive. Store each revision so you can distinguish adaptation from target drift.
What does the PRISM briefing card add?
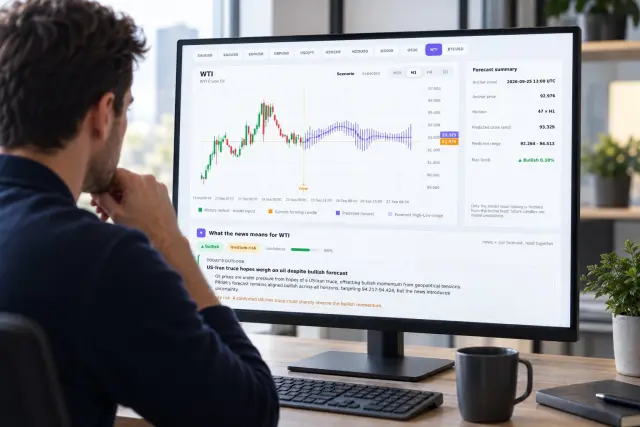
The live briefing card reads market news against the relevant forecasts. It reports direction, risk, and how many levels were flagged, while member access controls the numerical levels. It is context for the forecast object, not a replacement for outcome scoring.
Use the forecast object as your test
A gold price forecast AI earns attention through a clear object and an auditable result. Specify the horizon, preserve the timestamp, score every OHLC field, and publish the re-anchoring rule. Forecasts are model output, not financial advice. Read PRISM’s model and method before you size any decision →