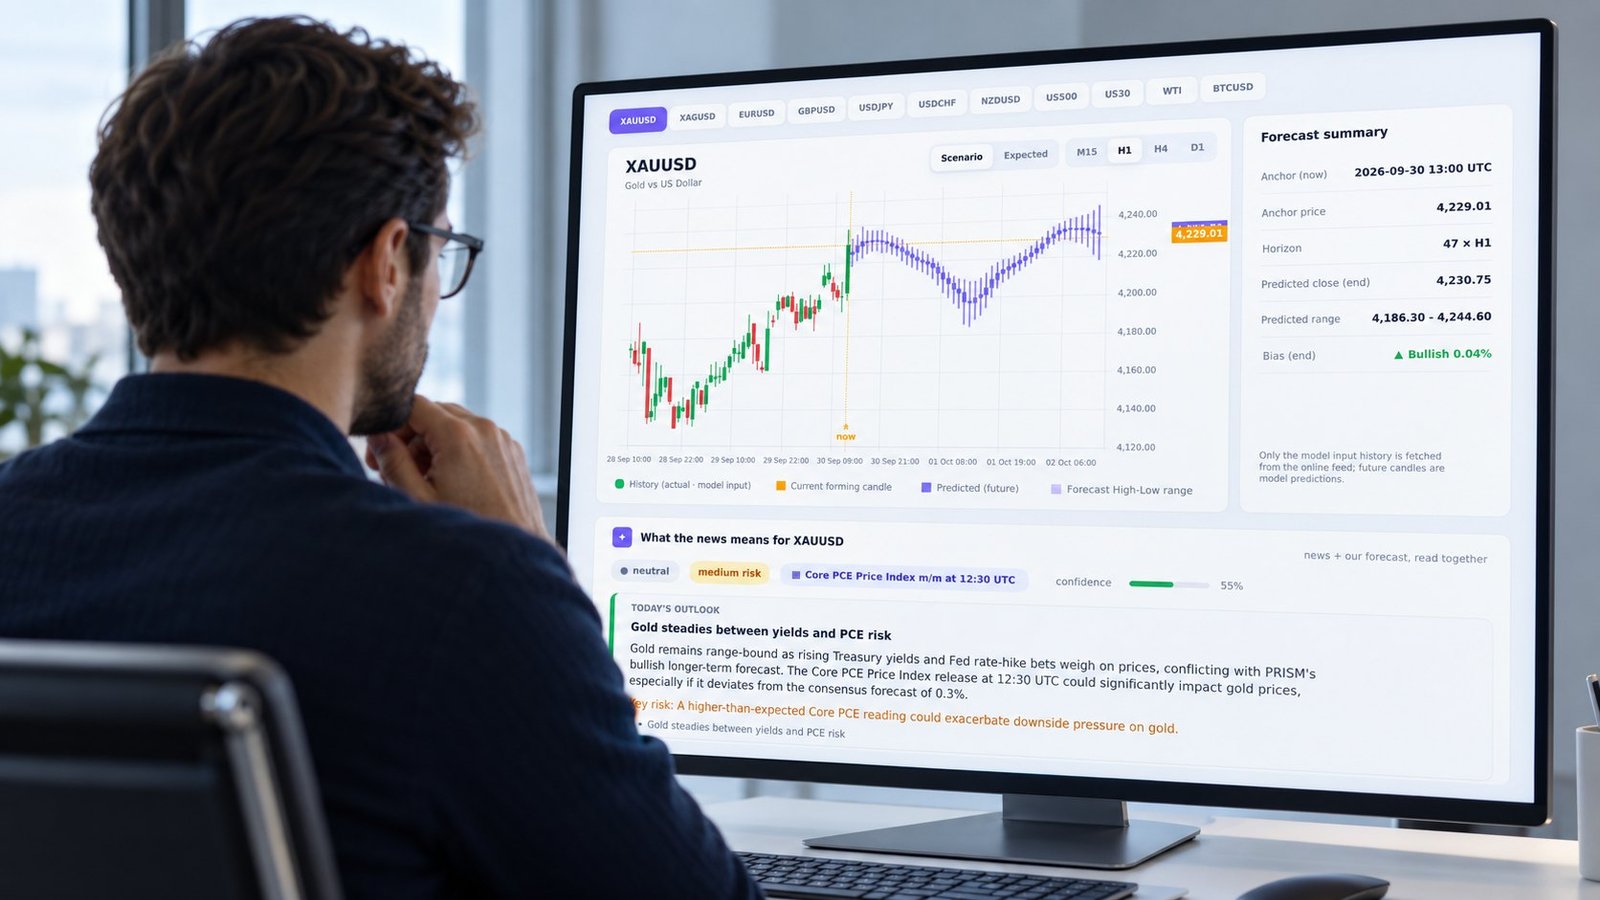
Gold ETF Holdings vs Flows: A Trading Test
Learn how gold ETF holdings vs flows differ, how AUM misleads, and how PRISM aligns slow ETF data with 48-hour XAUUSD forecasts.
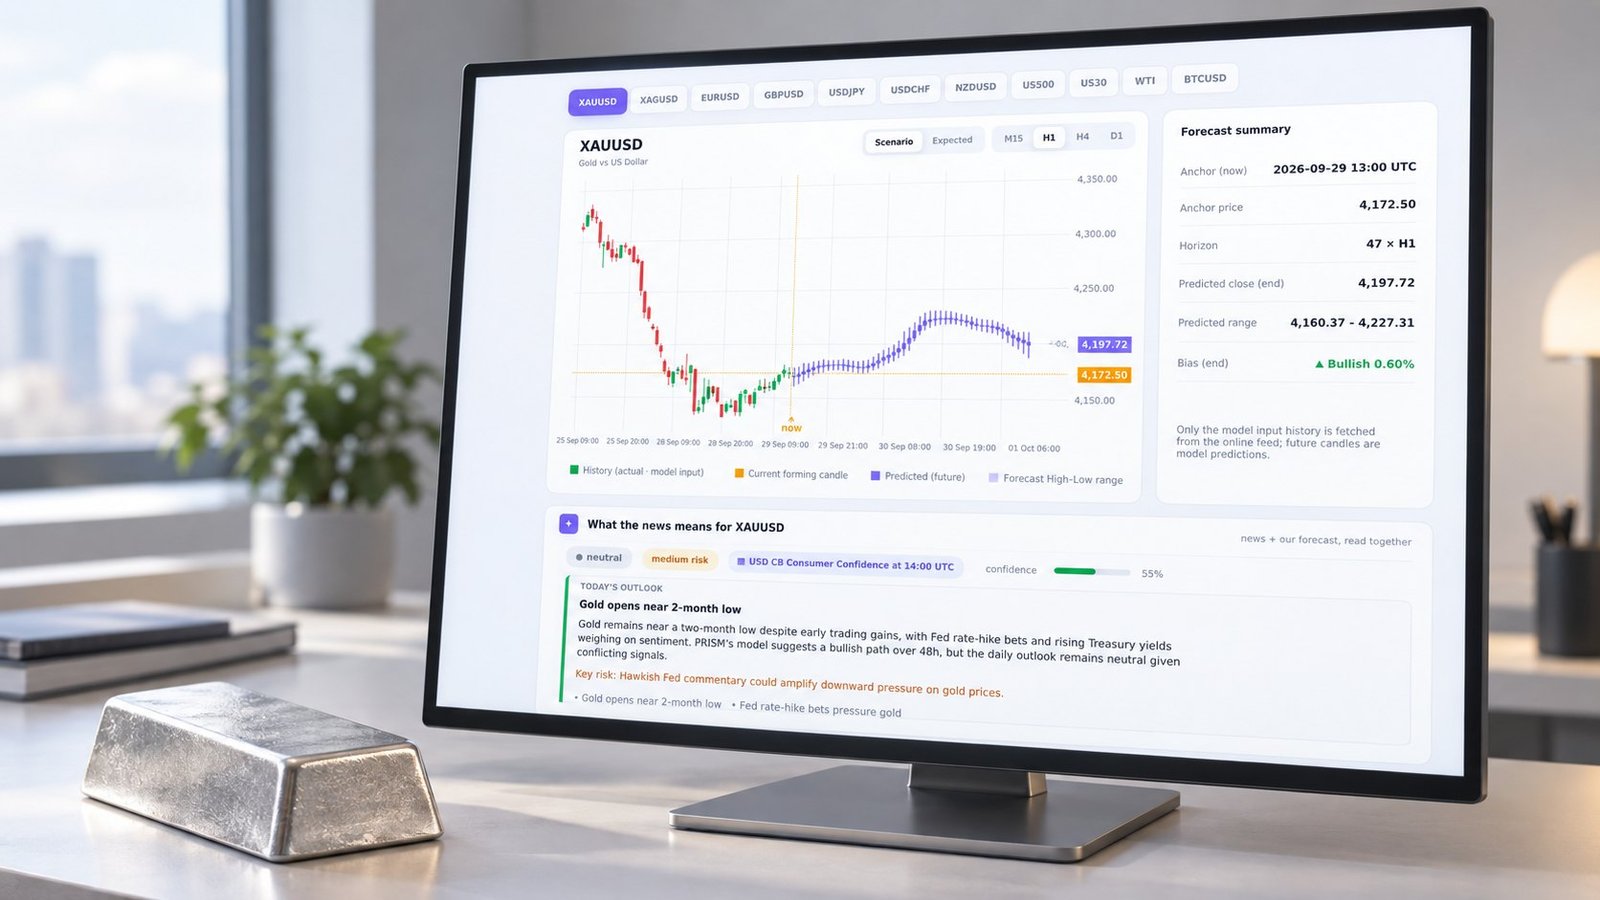
How Interest Rates Affect Silver
Learn how interest rates affect silver by tracing real yields, the dollar, and priced-in surprises across PRISM’s 48-hour forecast horizons.

Bitcoin Liquidity: Reading Forecast Uncertainty
Learn how bitcoin liquidity shocks alter short-horizon forecast confidence with Treasury yields, DXY, Fed measures, OHLC ranges, and 15-minute re-anchoring.
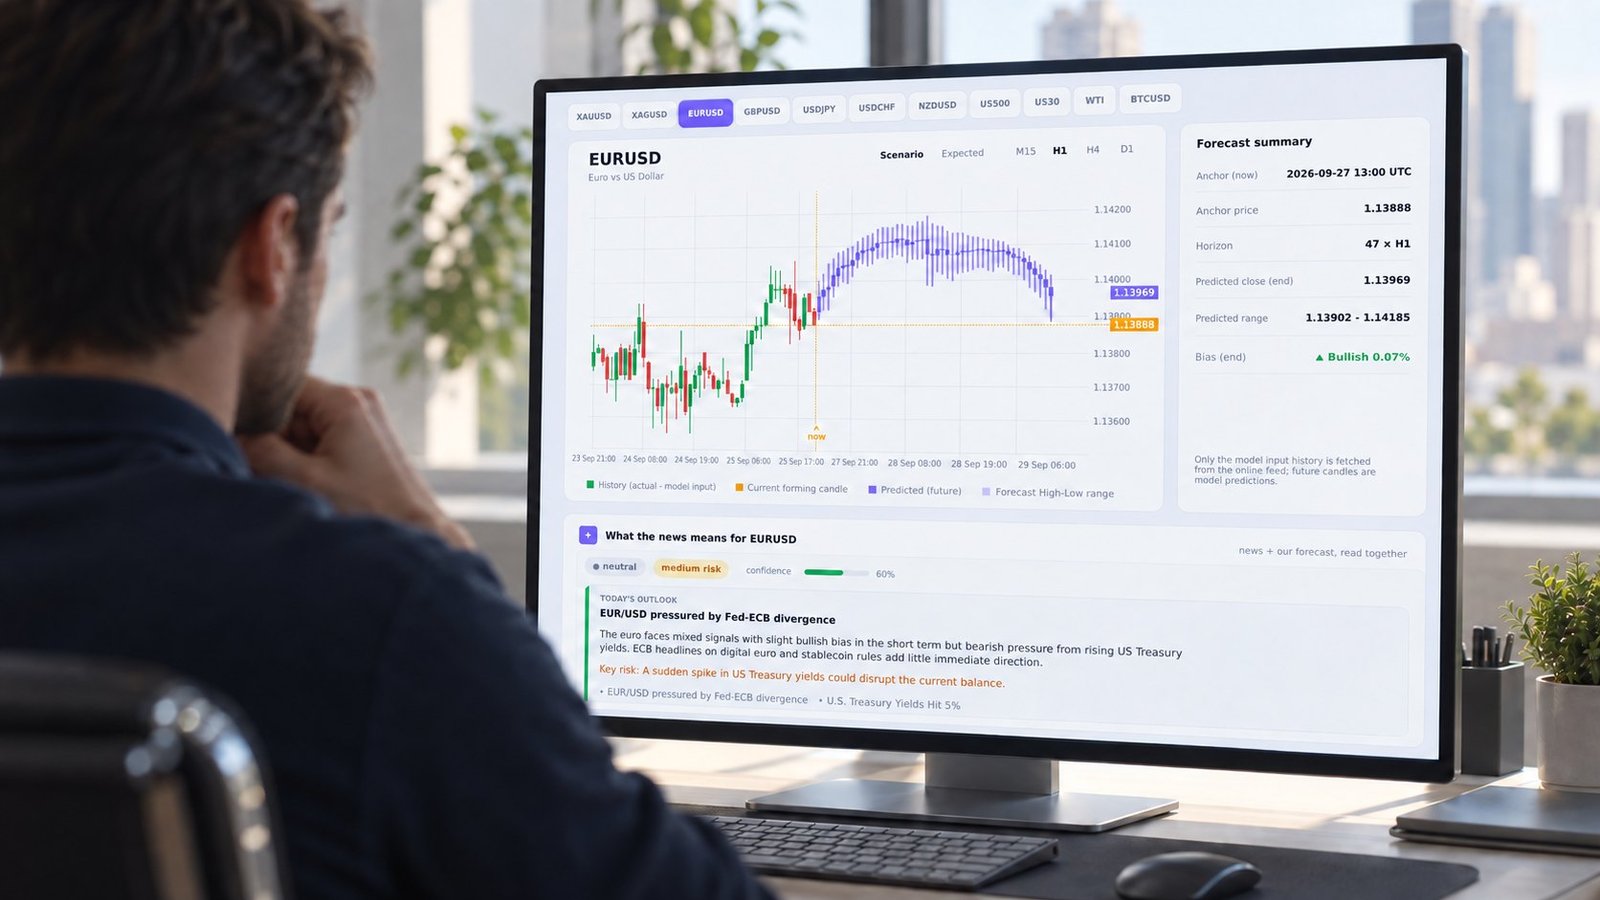
EUR/USD forecast vs spot: From consensus to candles
Compare EUR/USD bank targets with PRISM's 48-hour OHLC forecasts. Measure pip gaps, forecast dispersion, and horizon mismatch before acting.
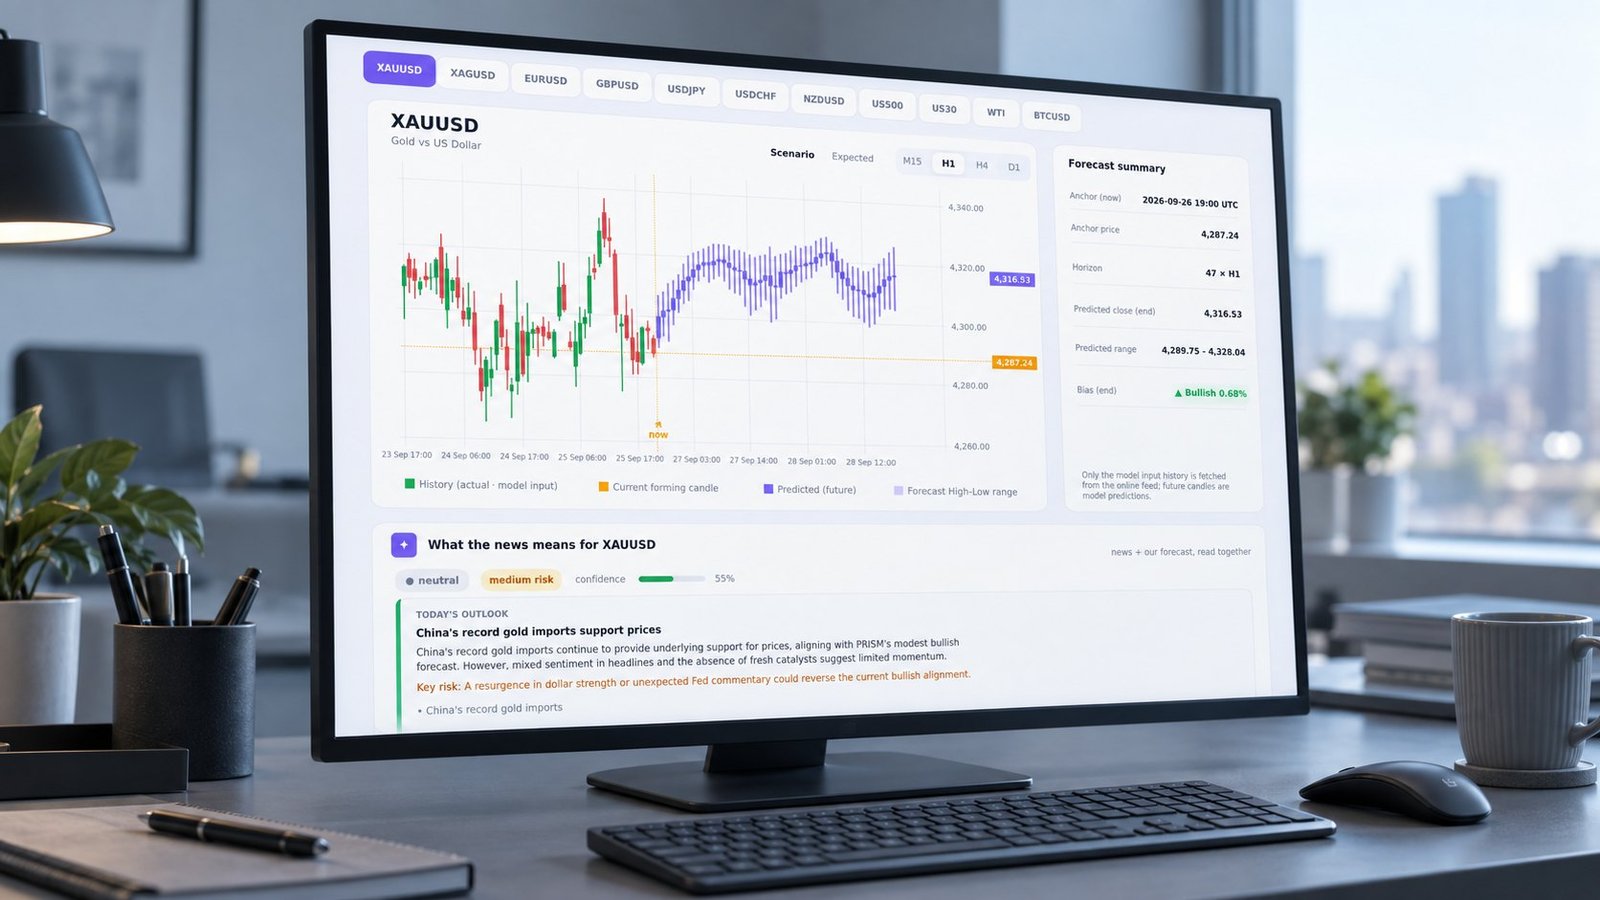
How Real Yields Affect Gold in PRISM Forecasts
Learn how real yields affect gold, separate nominal from inflation-adjusted rates, and read conflicting M15-to-D1 signals in a 48-hour forecast.

Oil Price Expectations Across Forecast Horizons
Learn how to reconcile oil price expectations, compare OPEC, IEA and bank outlooks, and test long-horizon revisions against PRISM WTI OHLC behavior.

Gold Price Prediction 2026: Read the Horizon
gold price prediction 2026 is a horizon problem. Learn how annual targets, scenario ranges, and 48-hour OHLC forecasts differ—and when each fails.

Gold Market Prediction Across 48 Hours
Compare a gold market prediction across M15, H1, H4 and D1 with OHLC paths, direction probability, confidence and invalidation.

Gold Price Prediction Today: A 48-Hour Audit
Gold price prediction today, tested as a re-anchored 48-hour XAU/USD OHLC scenario with MAE, range coverage, failure points, and invalidation rules.

Energy Shock Forex Prediction for 48 Hours
Energy shock forex prediction for the next 48 hours, with PRISM OHLC candles, ECB energy inflation, and USD/CAD and EUR/NOK signal checks.

Multi-Timeframe Analysis Forex: Fixing Stale Bias
Multi-timeframe analysis forex traders use to align higher-timeframe bias with lower-timeframe entries, and how to catch a stale bias before it costs you.