
An energy shock forex prediction is a 48-hour problem, not a broad oil-market thesis. You need to know whether the headline changes direction, candle range, or both. PRISM measures that shift through predicted OHLC candles, direction probability, and calibrated uncertainty across M15, H1, H4, and D1.
The current setup creates a useful pair-level contrast. AP News reports that the ECB raised rates by 25 basis points to 2.50% because energy-driven inflation remained elevated. Euro-area inflation reached 3.3% in August, while oil traded above $100 per barrel. ING then sees mild upside risk in USD/CAD and downside risk in EUR/NOK. Your task is to test those ideas against a re-anchored 48-hour path.

Why an Energy Shock Forex Prediction Moves Fast
Energy headlines affect FX through two channels. The first is the rate channel. Higher energy costs can keep inflation above target, which changes the expected path for central banks. The second is the growth channel. Energy importers may lose purchasing power, while exporters can receive support from stronger terms of trade. Both channels can appear in the same 15-minute session.
AP News provides the rate-market anchor for this case. The ECB’s 25-basis-point move to 2.50% signals that policymakers still see energy inflation as persistent. The 3.3% August inflation figure explains why the move matters. Oil above $100 adds range risk because traders must price both stronger inflation and weaker demand.
Two benchmark signals, one short horizon
ING’s September FX Talking report gives the cleanest pair contrast. Its USD/CAD view is mildly bullish, with a one-month target near 1.39. ING links that view to tariff and energy risks that could weigh on Canadian activity and employment. A USD/CAD forecast can therefore rise even while CAD remains a commodity currency.
The same report expects EUR/NOK downside toward 10.70. ING argues that supportive oil and gas prices can keep the krone appealing, although the longer path may flatten if energy prices ease. That is why an oil price forex forecast should be read as a currency transmission problem, not as a crude trading plan.
- Rate pressure can widen expected candle ranges before direction becomes clear.
- Growth pressure can weaken an energy-linked currency despite higher commodity prices.
- Exporter and importer pairs may respond in opposite directions to the same headline.
- A 48-hour forecast is most useful when probability and range are read together.
PRISM’s Energy Shock Forex Prediction Snapshot
PRISM’s public market set does not list USD/CAD or EUR/NOK. It does provide commodity-sensitive proxy views through XAUUSD and NZDUSD, alongside other major markets. The snapshot below uses those available symbols to show how the model measures an energy shock. The figures represent the first forecast candle at each timeframe within the same 48-hour horizon.
Exact update time: September 12, 2026, 15:00 UTC. Anchor prices are XAUUSD 3644.80 and NZDUSD 0.59620. Read the OHLC values as model output, not as observed prices. Direction probability estimates the chance of an upward close for that candle. Sigma represents the model’s expected close uncertainty in price units.
- XAUUSD M15 — O 3644.80, H 3647.30, L 3641.90, C 3643.60; P(up) 46%; ±σ 4.20.
- XAUUSD H1 — O 3644.80, H 3653.80, L 3636.10, C 3648.20; P(up) 52%; ±σ 9.10.
- XAUUSD H4 — O 3644.80, H 3667.40, L 3628.20, C 3658.60; P(up) 58%; ±σ 18.60.
- XAUUSD D1 — O 3644.80, H 3702.00, L 3608.00, C 3675.00; P(up) 61%; ±σ 38.00.
- NZDUSD M15 — O 0.59620, H 0.59670, L 0.59560, C 0.59600; P(up) 49%; ±σ 0.00055.
- NZDUSD H1 — O 0.59620, H 0.59780, L 0.59480, C 0.59710; P(up) 54%; ±σ 0.00120.
- NZDUSD H4 — O 0.59620, H 0.60060, L 0.59290, C 0.59910; P(up) 58%; ±σ 0.00250.
- NZDUSD D1 — O 0.59620, H 0.60680, L 0.58910, C 0.60200; P(up) 63%; ±σ 0.00540.
What the OHLC path says
The snapshot shows a split between short-term noise and higher-timeframe drift. XAUUSD has a 46% M15 upward probability but a 61% D1 probability. NZDUSD shows the same pattern, moving from 49% on M15 to 63% on D1. That is not a permission slip. It means the model sees a stronger two-day endpoint than the next quarter-hour.
Range expands with horizon. XAUUSD’s first M15 candle spans 5.40 points from low to high. Its D1 range spans 94.00 points. NZDUSD expands from 0.00110 to 0.01770. You should treat that widening as a sizing constraint. A directional probability without its expected range is incomplete.
See also: Multi timeframe forecast alignment
How 15-Minute Re-Anchoring Tests the Shock
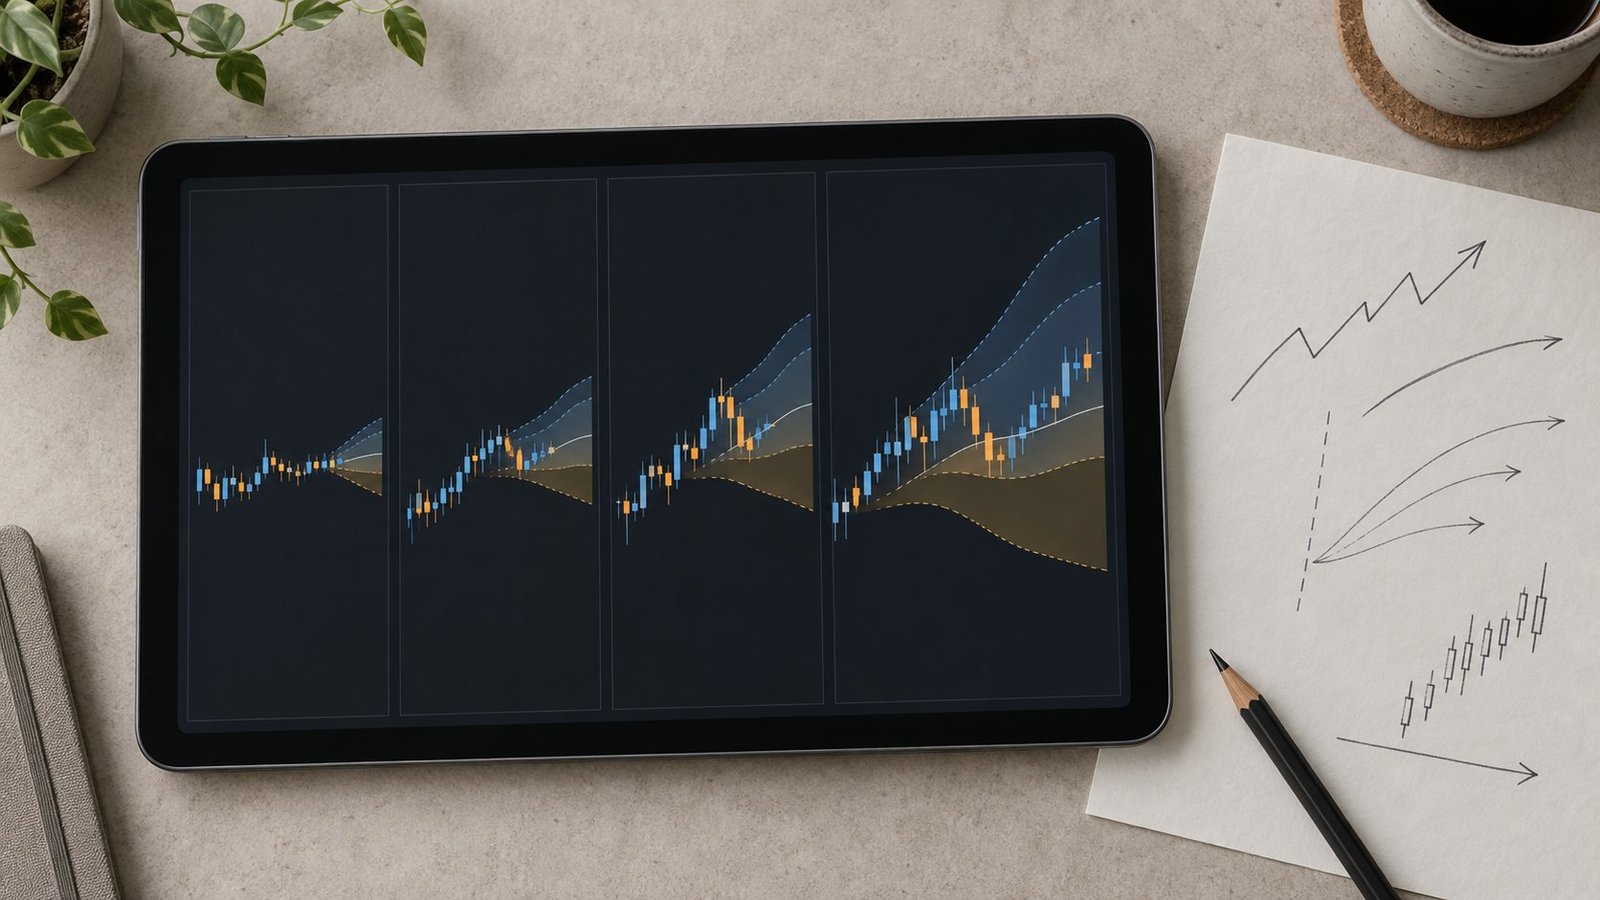
PRISM re-anchors every 15 minutes when a new quarter-hour candle arrives. Each refresh ingests the latest market state and rebuilds the next 48 hours. The forecast does not simply slide forward unchanged. Its future OHLC path, direction probability, and sigma can all move.
This matters because an energy shock can broaden, fade, or split across currencies. A broadening shock usually pushes uncertainty higher across related markets. You may see larger M15 and H1 ranges, rising sigma, and stronger agreement between gold, NZDUSD, and the longer D1 path. A fading shock often produces narrowing bands and probabilities drifting back toward 50%.
A practical read for your chart
- Record the anchor time and current price before reading the new path.
- Compare M15 and H1 range changes with the H4 and D1 endpoint probability.
- Check whether commodity-sensitive markets confirm the same direction or produce conflicting signals.
Conflicting pair signals are also information. ING’s USD/CAD forecast can be mildly bullish because Canadian tariff and activity risks dominate. ING’s EUR/NOK forecast can point lower because energy revenue supports NOK. Those views are not logically inconsistent. They describe different rate, growth, and terms-of-trade exposures.
PRISM helps you separate that macro story from the candle response. Its 254 future candles include 192 M15 candles, 48 H1 candles, 12 H4 candles, and 2 D1 candles. The views are nested, so four M15 candles aggregate into each H1 candle, and sixteen M15 candles aggregate into each H4 candle. The model measures path structure, not just a single target.
The model stops being reliable when a new shock invalidates the information set faster than the next re-anchor can absorb it. Sudden gaps, liquidity loss, spread expansion, and policy surprises can push realized candles outside the expected sigma band. The display is a decision aid for uncertainty. It is not financial advice.
See also: fed rate decision september 2026 forex
Energy Shock Forex Prediction FAQ
What does the 48-hour horizon measure?
It measures the predicted OHLC path from the current anchor through the next 48 hours. M15, H1, H4, and D1 describe the same endpoint at different resolutions.
Why can USD/CAD and EUR/NOK disagree?
They carry different exposures. Canadian activity and tariff risk can favor USD/CAD upside, while oil and gas support can favor NOK and push EUR/NOK lower.
How should you use sigma?
Sigma is the model’s estimated close uncertainty. A wider value means the path deserves more distance and less conviction, even when direction probability exceeds 50%.
Use the Forecast as a Live Evidence Stream
An energy shock forex prediction works best as a sequence of measured updates. Start with the AP News inflation and ECB rate signal. Compare it with ING’s USD/CAD and EUR/NOK scenarios. Then inspect the available PRISM proxy markets at M15, H1, H4, and D1. The PRISM model overview explains the probability and uncertainty fields, while the MT5 indicator places the same 48-hour candle path on your chart. Open PRISM’s live 48-hour forecast board and reassess after each 15-minute anchor →
Forecasts are model output, not financial advice. You still define the setup, account for spread in pips, and decide whether the expected range fits your drawdown limits.