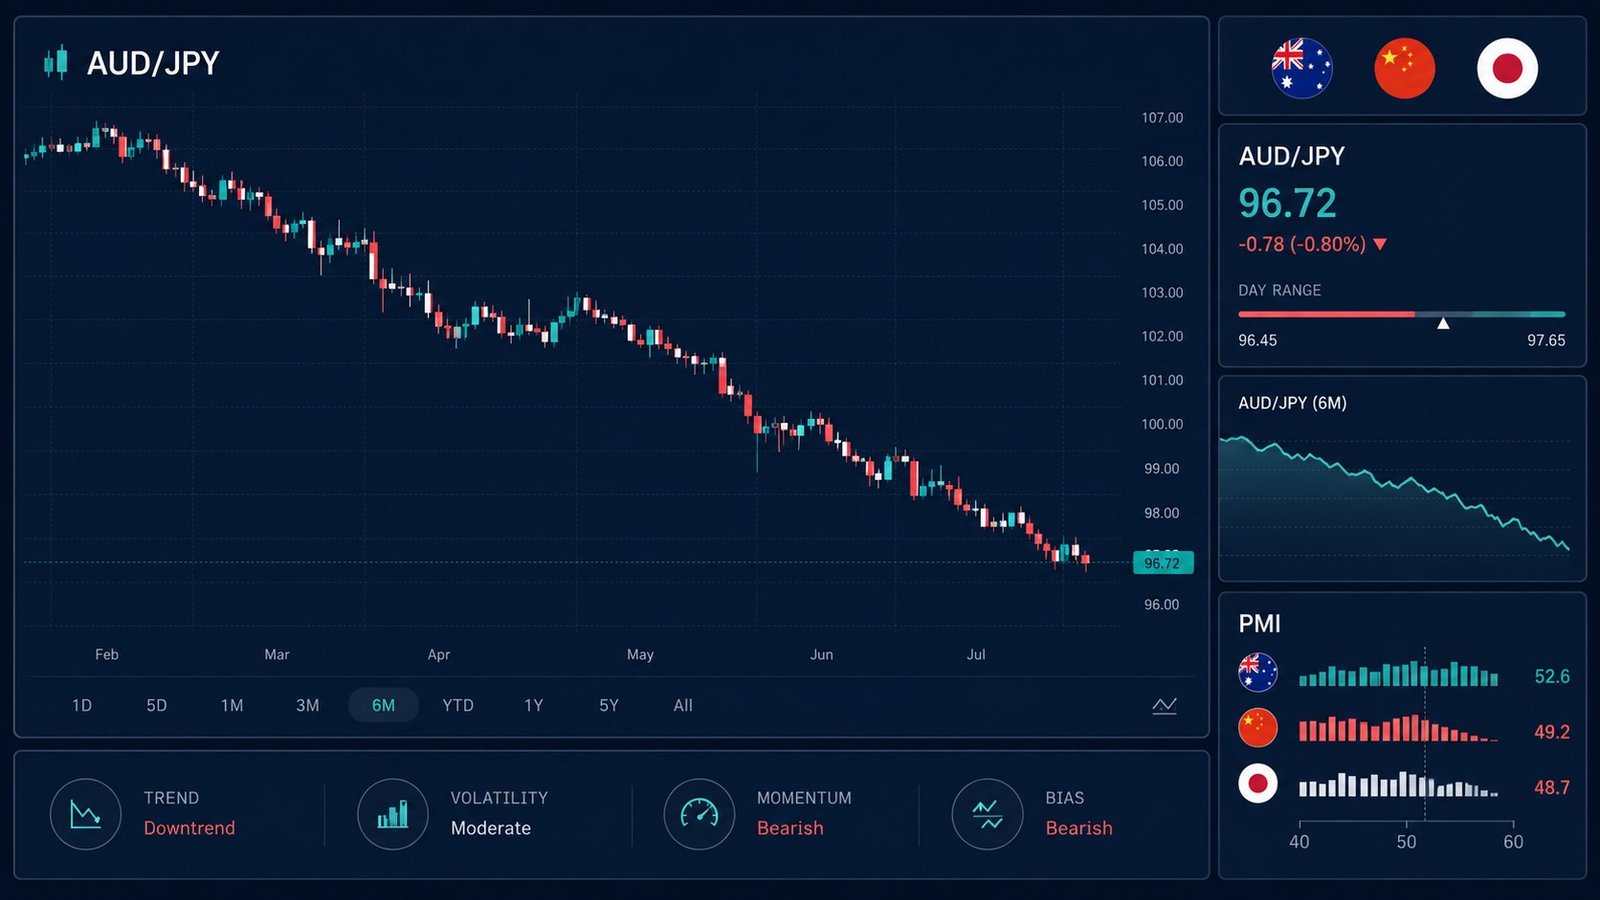
Today's forex news centers on a familiar pair: AUD/JPY. The Australian Dollar dropped for a fourth straight session against the Japanese Yen, trading near 113.50 during Thursday's Asian session. Behind the move sits a batch of PMI data out of China and Japan, plus a softer Australian trade surplus. None of these releases move a chart by themselves — they shift probabilities, session by session. That's exactly what a multi-timeframe model is built to track.
This breakdown covers what actually changed in the data, why Yen strength may have a ceiling, and how to read a session like this across M15 through D1 without guessing at direction.
What's Driving the Forex News Cycle Today
Australia's Trade Balance narrowed to A$1,923M in July, down from a revised A$2,341M surplus in June. The number still beat market consensus of A$1,390M, but the internals tell a weaker story. Exports fell 3.3%, reversing a 9.1% jump the month before. Imports slipped 2.5% over the same period. A narrower surplus with falling exports is not a strong setup for the Australian Dollar, even when the headline print beats expectations.
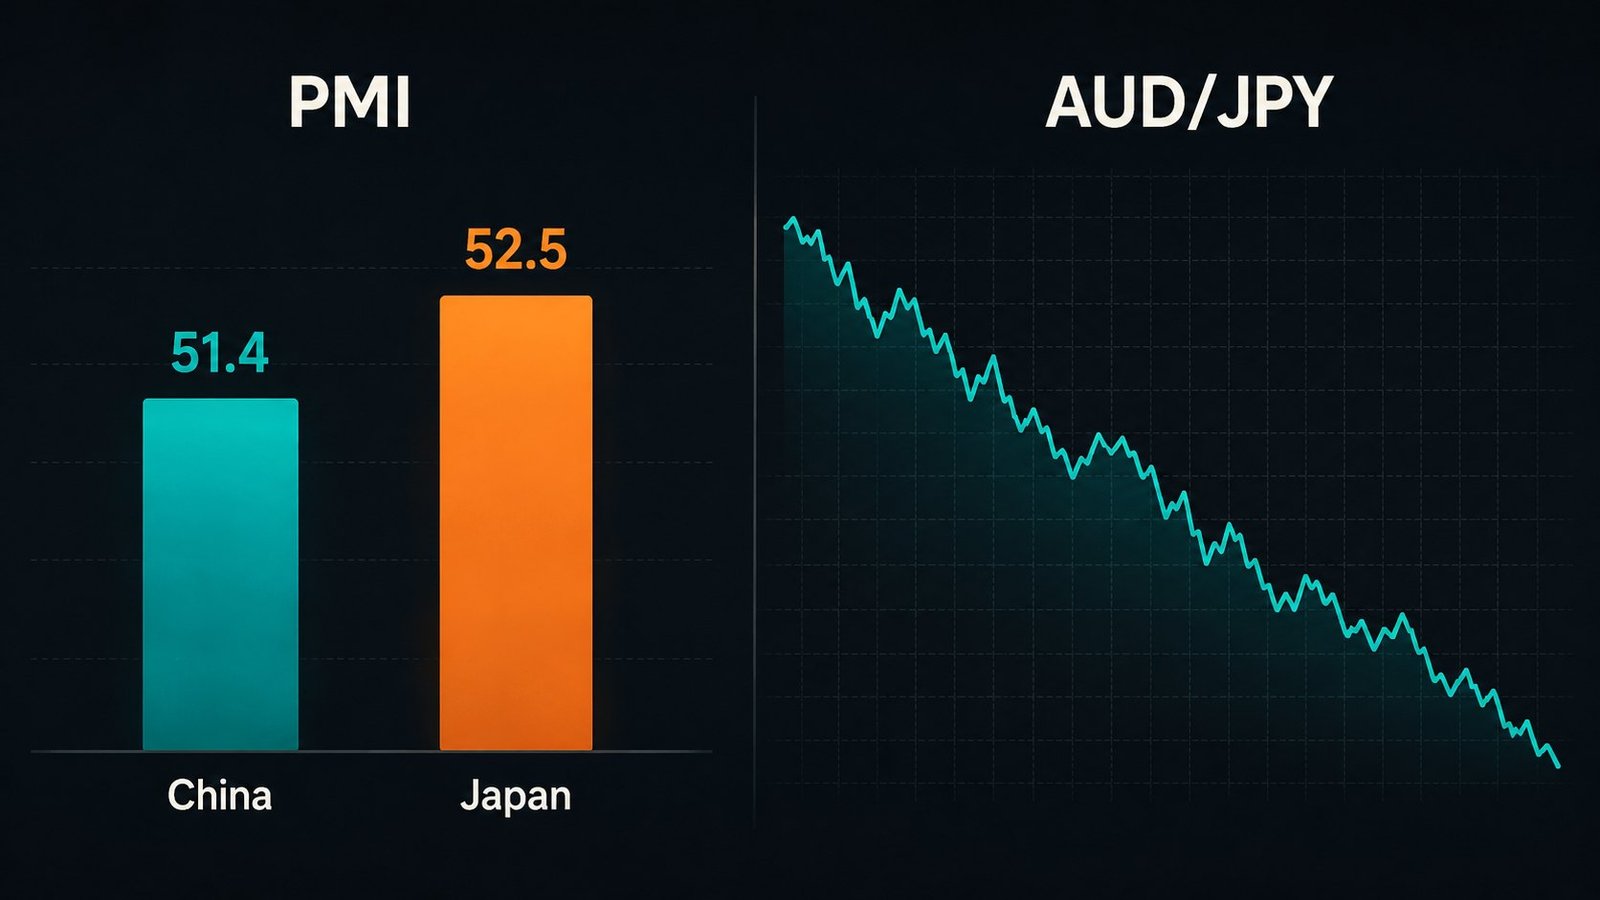
China supplied the one genuinely bullish data point. The China Services PMI, compiled by Caixin Insight Group and S&P Global under the RatingDog name, rose to 51.4 in August from 50.4 in July, comfortably ahead of the 50.6 forecast. Anything above 50 signals expansion in China's services sector, and a beat of this size usually supports risk sentiment across the region, the Australian Dollar included. In this case, it wasn't enough to offset the AUD/JPY slide, which tells you the Yen side of the pair did more of the work.
Japan's PMI Streak: 17 Months of Expansion
Japan's PMI data ran in the opposite direction, and it's the more important half of this forex news story for AUD/JPY specifically. The Jibun Bank Services PMI expanded to 52.5 in August, up from 51.2 in July and slightly above the 52.3 flash reading. That's the fastest services growth pace since March, driven by a rebound in new orders after they hit a 25-month low in July.
Broader activity confirmed the trend. The Jibun Bank Composite PMI reached 53.5 in August, above both the 53.4 flash estimate and July's 52.7 reading. It's the highest composite print since February, and it extends Japan's private-sector expansion streak to 17 consecutive months.
- Australia Trade Balance: A$1,923M in July, down from A$2,341M — still above the A$1,390M consensus
- China Services PMI: 51.4 in August, up from 50.4, ahead of the 50.6 forecast
- Japan Jibun Bank Services PMI: 52.5 in August, up from 51.2, above the 52.3 flash
- Japan Jibun Bank Composite PMI: 53.5 in August, the highest since February, 17 straight months of expansion
Why Yen Strength May Have a Ceiling
Strong PMI data alone hasn't convinced everyone that the Yen is set for a lasting rally. Strategists at BNY Mellon say they're skeptical of Japanese authorities' ability to boost the currency in a durable way. They point to comments from U.S. Treasury Secretary Scott Bessent, who noted this week that Abenomics was reflationary and that Japan can, in his words, sit back and enjoy it.
BNY's read is straightforward: in low-growth, low-yield economies, a reflation period makes currency performance easier to tolerate, not necessarily stronger. That framing matters for anyone trading AUD/JPY on this forex news cycle — a softer Yen bias can coexist with strong PMI prints, because policymakers may prefer a manageable currency over a sharply appreciating one.
Trading Forex News Across Multiple Timeframes
A single PMI release rarely tells you where a pair goes next. What it does is shift the probability distribution around the next few candles, and that distribution looks different on M15 than it does on D1. A four-day losing streak in AUD/JPY, like the one running into Thursday, shows up as noise on a 15-minute chart and as a clear trend on H4 and D1.
PRISM Forecasting re-anchors its models every 15 minutes and produces 48-hour OHLC candle forecasts across 11 markets and 4 timeframes — M15, H1, H4, and D1. When a print like China's 51.4 or Japan's 53.5 lands, the model doesn't predict the number. It updates the probability and confidence behind the next candles for the pairs you're watching, so you can compare what the forecast implies against what the news implies — effectively building your own AUD/JPY forecast timeframe by timeframe. That's the core idea behind multi-timeframe forex forecasting: no single chart tells the whole story.
See the reasoning behind those updates on The Model, or run the same signals through the MT5 Indicator if you trade directly from your platform. Forecasts are model output, not financial advice — you still size the trade and set the stop.
Forex News FAQ: AUD/JPY and PMI Data
What does a Services PMI above 50 mean for a currency?
It means the services sector expanded that month compared to the one before. A reading above 50 is generally read as supportive for the currency; below 50 signals contraction. China's 51.4 and Japan's 52.5 both point to expansion, though the size of the beat matters as much as the direction.
Why did AUD/JPY fall despite better China data?
Because Japan's data was stronger on a relative basis. Japan's Composite PMI hit a 17-month expansion high while Australia's trade surplus narrowed. AUD/JPY trades on the gap between the two economies, not on either one in isolation.
How often should you check forex news for short-term trades?
For M15 and H1 setups, check the economic calendar every session — Asian, European, and US. For H4 and D1 positions, a daily review of PMI, trade, and central bank releases is usually enough to keep your forecast context current.
Read the Next Session Before It Prints
PMI beats and trade balance misses keep landing every week, and each one is fresh forex news that nudges pairs like AUD/JPY a little further in one direction or another. The data above is already priced into current candles — what matters next is how the market digests it over the coming 48 hours. Check the Live Forecast for AUD/JPY and the other 10 markets PRISM covers, weigh the probability and confidence behind each timeframe, and size your position from there, not from a headline alone. For more coverage like this, browse the Blog.