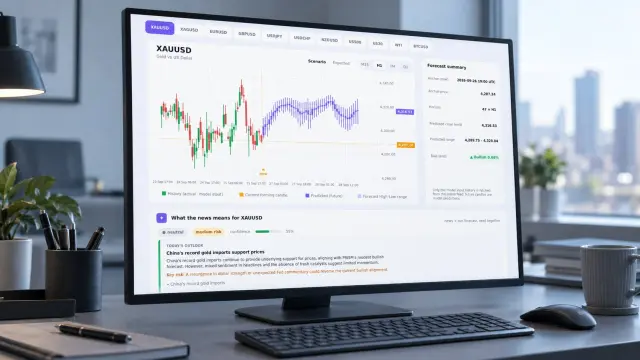
Multi-timeframe analysis forex traders rely on comes down to one sequence: set your bias on a higher timeframe, then refine the entry on a lower one. That's the entire method. Which pairs of charts you use, how many candles you wait for, what confirmation you require — all of that is a variation on the same rule. Skip the sequence and you're not doing multi-timeframe analysis. You're looking at two unrelated charts and calling it a system.
This guide covers the standard timeframe pairings, the stacked-entry logic behind them, and the two mistakes that quietly wreck most setups. It also covers a failure mode most guides mention and never solve: your higher-timeframe bias going stale between the moment you set it and the moment your lower-timeframe trigger fires. PRISM forecasts four timeframes at once and re-anchors every 15 minutes — we'll show exactly how to use that to check whether a bias is still valid before you act on it.
Multi-Timeframe Analysis Forex: The Top-Down Principle
The idea behind higher timeframe bias lower timeframe entry trading isn't complicated, but the name oversells it. "Multi-timeframe" sounds like you're supposed to watch four or five charts at once. In practice you're running a hierarchy: one chart tells you what's true, the other tells you when to act on it.
Axiory's framework for multiple timeframe analysis puts it plainly: the higher timeframe establishes the dominant trend and the key structural levels, and the lower timeframe exists only to time the entry inside that structure. You never use the higher chart to time a trade — it's too slow for that. You never use the lower chart to set direction — it doesn't hold enough context to tell a reversal from a retrace.
Concretely: an H4 chart in a clean uptrend gives you direction, full stop. Drop to M15 and you're not asking whether to buy or sell — that's already answered. You're asking whether price has pulled back to a level where buyers have shown up before, and whether the M15 has printed a rejection candle to confirm it.
Standard Timeframe Pairings for Forex Trading
Which pairing you use depends on how often you can check price and how long you're willing to hold a position. Three combinations cover almost every retail trading style, and each maps to a distinct pace of trading.
Swing Trading: Daily + 4H
Swing traders set bias on the Daily chart and refine entries on the 4H. One D1 candle compresses six 4H candles, so you get a session's worth of pullback structure without opening a chart you have to watch all day. A D1 uptrend with a 4H pullback into a prior breakout zone is the standard long setup here; holding periods usually run two to five days.
Day Trading: 4H + 1H + 15M
Day traders stack three charts instead of two — 4H for bias, 1H for structure, M15 for the trigger. This 4H/1H/15M stack is the multi timeframe trading strategy 2026 day traders lean on most, because it fits inside a normal session without demanding constant screen time: check the 4H once at the desk, watch the 1H for a zone, wait for the M15 to confirm.
The Triple Screen System: Weekly / 4H-1H / 30M
The triple screen trading strategy — built around three chart tiers rather than three fixed timeframes — maps onto forex as Weekly for macro bias, 4H or 1H for the intermediate trend, and 30M for entry timing, per both Axiory and ChartSnipe. It's the most conservative of the three pairings because the top tier moves slowly: a Weekly bias rarely flips inside a single trading week, so once it's set, most of your daily work happens on the two lower tiers.
See also: fed rate decision september 2026 forex
Why Most Lower-Timeframe Breakouts Fail Without HTF Confirmation
Axiory's research puts a number on an intuition every discretionary trader eventually develops: roughly 85% of intraday lower-timeframe breakouts fail when there's no higher-timeframe confirmation behind them. An M15 breakout out of a range looks identical whether it's happening inside an H4 downtrend or an H4 uptrend. The candle doesn't know the difference — you have to supply that context yourself.
Compare that to the other end of the spectrum. ChartSnipe's data on well-structured HTF-rejection setups — higher-timeframe resistance or support confirmed by a lower-timeframe rejection candle — puts win rates in the 55–65% range, with winning trades averaging 2-3R. The gap between an 85% failure rate and a 55–65% success rate is the higher-timeframe filter. Same lower-timeframe candle. Different context. Different outcome.
- A H4 or Daily structural level — a swing high or low tested and held at least once, not five times.
- Price actually arriving at that level, not just moving toward it — a signal 40 pips from the zone is noise, not confirmation.
- A rejection or continuation candle on the lower timeframe at the level itself — engulfing, pin bar, or a clean break-and-retest.
- Directional agreement between the HTF trend and the LTF trigger — never a countertrend scalp inside a dominant HTF trend.
Two Mistakes That Wreck Multi-Timeframe Setups
Both Axiory and ChartSnipe flag the same two errors, and they show up in roughly this order of frequency.
- Stacking more than three timeframes. Four or five charts doesn't add precision — it adds noise and hesitation. Every pairing above uses two or three charts, never more. If you're flipping between W1, D1, H4, H1, and M15 before every trade, you're not doing multi-timeframe analysis, you're avoiding a decision.
- Trading against the higher timeframe during a regime change. This one is expensive. An H4 downtrend that's actually a Daily trend reversing looks, for two or three sessions, exactly like a normal pullback. Traders who anchor to the old HTF bias keep shorting into what's becoming an uptrend, and the losses compound because each one looks like bad luck instead of a stale read.
The Stale Bias Problem: Checking Whether Your HTF Read Still Holds
Here's what most MTFA guides skip: your higher-timeframe bias has an expiration date, and nothing on a standard chart shows it to you. You set your H4 bias at 8:00 London. By 11:30, after three New York data points and a Tokyo close, that H4 candle still hasn't closed — but the story behind it may already have changed. You're trading the 8:00 read against an 11:30 entry.

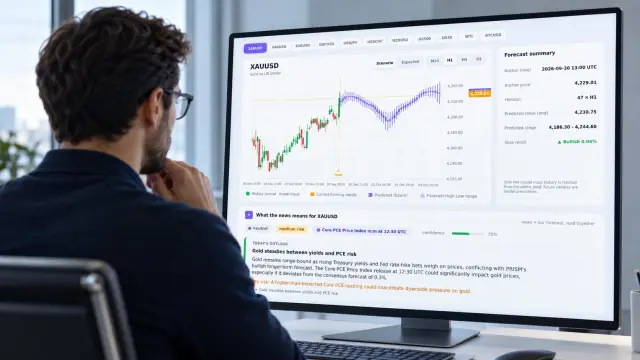
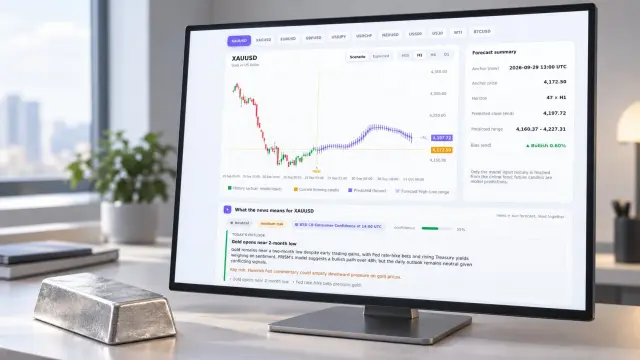
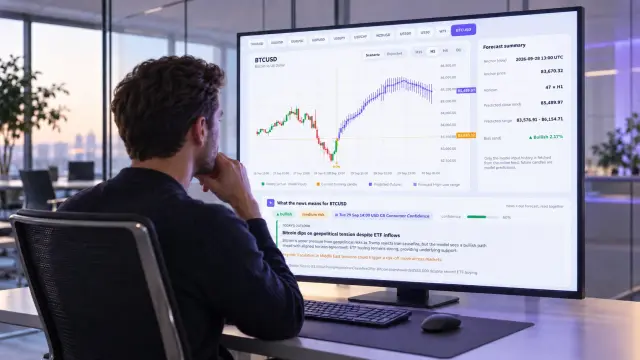
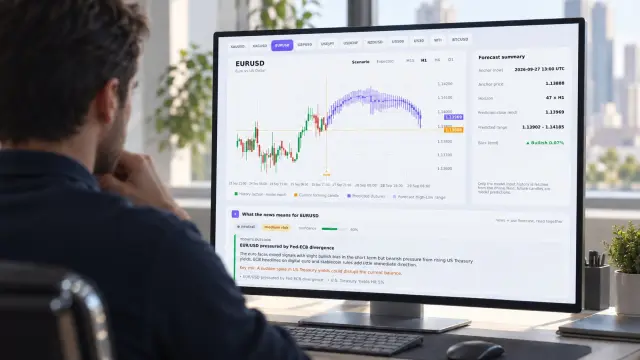
PRISM's model forecasts four timeframes — M15, H1, H4, and D1 — at the same time, and re-anchors every 15 minutes instead of waiting for a candle close. In practice, that means you can check the current H4 or D1 forecast against the one your bias was built on 45 or 90 minutes earlier. If the directional read and confidence on the higher timeframe haven't shifted, your bias is still fresh. If they've flipped or dropped, the M15 trigger in front of you is sitting on a stale foundation — the exact setup behind Axiory's 85% failure stat.
The check itself takes under a minute: open the Live Forecast for the pair, compare the current H4 or D1 read against your original bias, and only take the M15 or 30M trigger if the two still agree. The Model page explains how the re-anchoring works, but the trading habit is the point — treat your higher-timeframe bias as a number with a timestamp, not a belief you hold until proven wrong.
See also: forex news
FAQ
How many timeframes should I use for multi-timeframe analysis forex trading?
Two is enough for most traders — one HTF for bias, one LTF for entry. Add a third, triple-screen-style, only if you want an intermediate confirmation layer. More than three timeframes adds noise, not edge, per both Axiory and ChartSnipe.
What's the best timeframe combination for day trading?
How do I know if my higher-timeframe bias is still valid before I enter?
Recheck the higher-timeframe read right before your lower-timeframe trigger fires, not just once at the start of the session. PRISM re-anchors its H4 and D1 forecasts every 15 minutes for this reason — compare your original bias against the current read on the Live Forecast before acting.
Can the multi-timeframe bias check be automated?
Partially. The bias check can be scripted — PRISM's API exposes the same four-timeframe forecasts the dashboard shows, so you can pull the current HTF read programmatically. Reading the lower-timeframe confirmation candle still benefits from a human eye or a chart-based indicator.
Trading the Hierarchy, Not Just the Chart in Front of You
Multi-timeframe analysis forex trading rewards patience with sequence more than it rewards any single indicator. Set bias high, confirm low, and treat that bias as time-stamped, not permanent. The 85% failure rate on unconfirmed lower-timeframe breakouts and the 55–65% win rate on well-aligned HTF-rejection setups aren't two different strategies — they're the same trade, with and without the higher-timeframe filter.
If you'd rather have the bias check built into your charting workflow than run it manually every session, the MT5 Indicator plots PRISM's four-timeframe forecasts directly on your chart and updates with each 15-minute re-anchor, so the higher-timeframe read is visible the moment you drop to your entry timeframe. Forecasts are model output, not financial advice — the discipline of checking is still yours to keep. → Add it to your chart and check your next bias before you trade it.