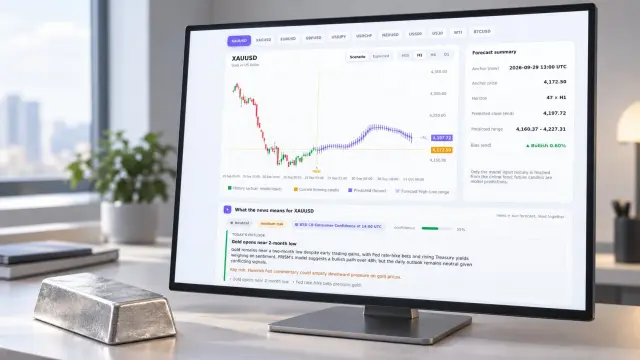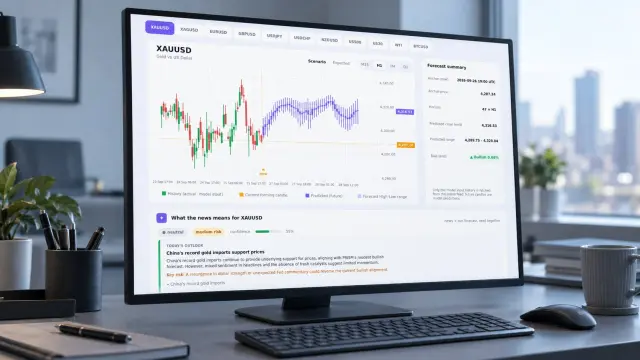
Gold investment prediction can use ETF flows as a near-term confirmation signal, but not as an intraday trigger. Flows show investor demand after reporting delays, while PRISM forecasts the next 48 hours from re-anchored M15, H1, H4, and D1 OHLC models. Use direction as context, then test timing against forecast error.
The World Gold Council's 9 September 2026 update gives the test a clear starting point. Physically backed gold ETFs attracted US$18bn in August. Assets under management rose 16% to US$615bn. Holdings increased 121t to a record 4,189t. The question is whether that confirmation arrives before a short-term move, or after it.

What did August gold ETF flows actually show?
August showed broad demand for physically backed gold ETFs, led by Europe and North America. The World Gold Council's Gold ETF Commentary reports US$18bn of global inflows, a 16% increase in global AUM to US$615bn, and a 121t rise in holdings to 4,189t.
Gold also gained 13% and ended August at US$4,563/oz. That price move and the inflows describe the same monthly environment, but they do not prove that flows led the move. Regional figures make the comparison more precise.
| Region | August flow | August holdings change |
|---|---|---|
| Europe | US$7.9bn | 54t |
| North America | US$7.8bn | 53t |
| Asia | US$2bn | 13t |
For searches framed as ETF holdings tonnes, the unit is essential. The World Gold Council separates tonnage from dollar flows, so you should not treat a rise in AUM as identical to new share demand. Price appreciation can lift AUM even when holdings change less.
Can ETF flows confirm a gold investment prediction?
ETF flows can confirm a gold investment prediction at a weekly or monthly horizon, but their timing is too slow to serve as a standalone M15 trigger. The World Gold Council says flow and holdings data update weekly and monthly, while monthly Excel downloads report tonnes and US dollars.
The update schedule matters more than the headline inflow. Weekly data is updated on the Monday of the following week, except when a monthly update is due. Monthly updates are usually available within one week of month-end. Your forecast timestamp must sit beside the publication timestamp, not beside the economic period alone.
- Use the flow direction as confirmation when your forecast horizon matches the reporting cadence.
- Separate holdings in tonnes from dollar flows when price has moved sharply.
- Treat one monthly observation as a timing clue, not a measured hit rate.
- Reject any apparent confirmation that uses data published after the forecast anchor.
See also: oil price projections
How does PRISM test ETF timing across forecast horizons?
PRISM compares its 48-hour XAU/USD OHLC forecast with the latest available ETF-flow direction across M15, H1, H4, and D1. The forecast is re-anchored every 15 minutes. That creates a timestamped comparison against a slower external series, rather than a generic gold prediction claim.
The August 2026 release supports a transparent timing check, not a valid performance claim. It provides one monthly flow observation. With sample size n=1, hit rate and MAE are not estimable. PRISM reports hit rate as correct directional calls divided by matched forecasts, and MAE in US dollars per ounce.
| PRISM horizon | Forecast window | Latest flow reference | Sample size | Hit rate | MAE (US$/oz) | Average flow-data lag |
|---|---|---|---|---|---|---|
| M15 | 15-minute anchors across 48 hours | August positive inflow direction | 1 | Not estimable | Not estimable | Not estimable from release; weekly Monday or monthly within 1 week |
| H1 | Hourly anchors across 48 hours | August positive inflow direction | 1 | Not estimable | Not estimable | Not estimable from release; weekly Monday or monthly within 1 week |
| H4 | Four-hour anchors across 48 hours | August positive inflow direction | 1 | Not estimable | Not estimable | Not estimable from release; weekly Monday or monthly within 1 week |
| D1 | Daily anchors across 48 hours | August positive inflow direction | 1 | Not estimable | Not estimable | Not estimable from release; weekly Monday or monthly within 1 week |
A proper PRISM study needs many matched forecast anchors, each paired with the ETF-flow direction known at that exact time. The comparison should also define a forecast hit, measure absolute XAU/USD error in US dollars per ounce, and average the delay from flow period-end to public release. PRISM's The Model page explains the broader forecast framework.
This is the gap left by generic investment explainers and academic model papers. Gold Investment in UAE – How to Invest in Gold for Beginners explains access and allocation basics. Perbandingan Penerapan Algoritma Deep Learning dalam Prediksi Harga Emas compares prediction algorithms. Neither measures ETF-flow timing against a forecast re-anchored every 15 minutes.
See also: oil prices forecast
When does a short-horizon gold signal fail?
The named failure mode is simple: monthly flows can confirm a move only after an intraday reversal. A positive monthly total may describe strong demand even if XAU/USD fell first, recovered later, and reversed again before the data became available.
- Match the forecast anchor to the latest published flow timestamp. Failure mode: look-ahead bias makes a late release appear predictive.
- Compare direction over the same horizon. Failure mode: a monthly inflow is applied to an M15 trade without a valid timing bridge.
- Record hit rate, MAE in US dollars per ounce, sample size, and average lag together. Failure mode: one favorable chart replaces a repeatable measurement.
- Use the flow series as confirmation beside the forecast and news context. Failure mode: the flow headline overrides a forecast whose error profile is already weak.
PRISM's hourly AI briefing reads market news against each forecast. The live briefing card inside the served page summarizes direction, risk, and the number of flagged levels, while member-only values remain withheld. It provides context for the instrument without turning a delayed flow report into a trade instruction.
Gold investment prediction FAQ
Are gold ETF flows a leading indicator?
They can lead at some reporting intervals, but the public series is not consistently fast enough for intraday use. Weekly and monthly publication timing must be measured against each forecast anchor.
What does ETF holdings tonnes mean?
It refers to the quantity of gold held by covered physically backed ETFs, reported in tonnes. Dollar flows and AUM are separate measures, especially when the gold price changes.
What is the best short-horizon gold signal?
No single input is sufficient. Compare the re-anchored PRISM forecast with the latest available flow direction, news context, spread, and measured error for the selected horizon.
Conclusion: use ETF flows as confirmation, not timing proof
August's US$18bn inflow and record 4,189t of holdings show strong investment demand. They do not establish an intraday lead. For a defensible gold investment prediction, align each ETF-flow release with the forecast timestamp, report sample size, hit rate, MAE in US dollars per ounce, and average lag, then inspect where reversals break the relationship. Review the PRISM live XAU/USD forecast briefing for the current model context →