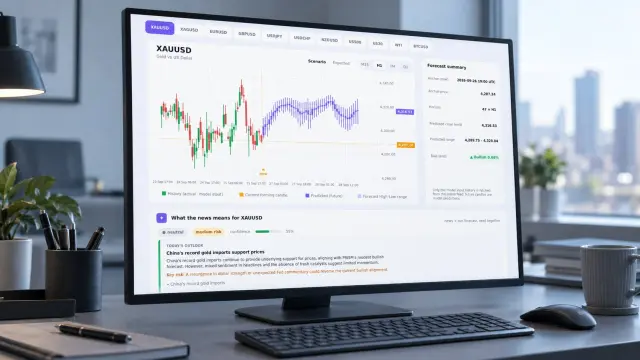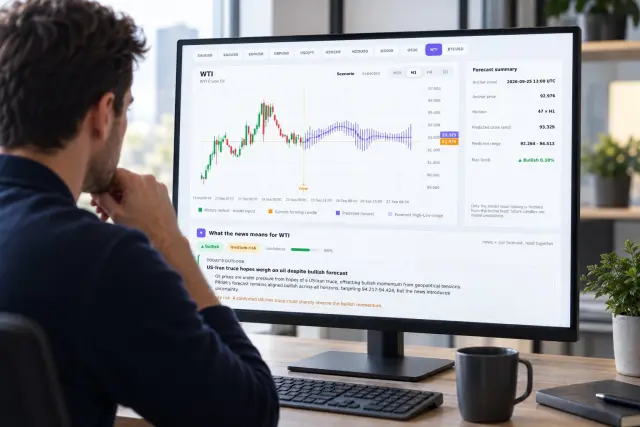
Ask five forex forecasting services for their accuracy rate and you'll get five different numbers — and none of them tell you what you actually need to know. The most predictable forex pairs are not a fixed list you can memorize once. A 2025 machine-learning study found directional accuracy shifts meaningfully from one USD pair to the next, which means a single headline accuracy figure hides more than it reveals.
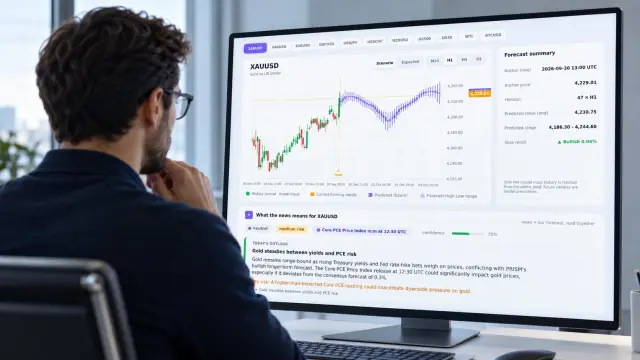
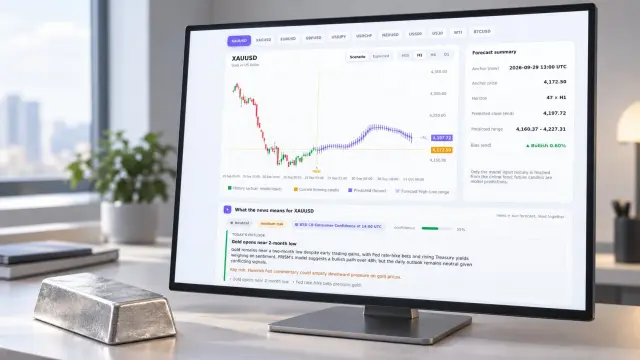
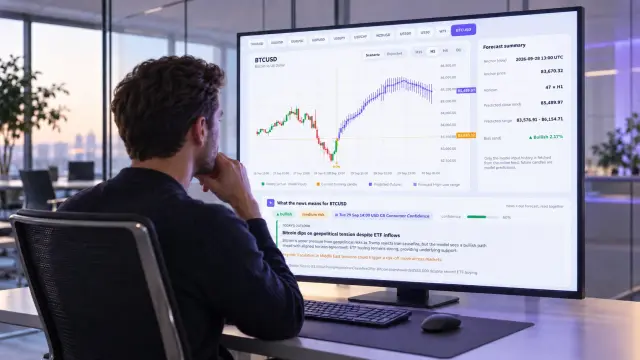
This matters more as forecasting tools expand across markets. PRISM runs independent 48-hour OHLC forecasts across 11 markets and 4 timeframes, re-anchored every 15 minutes — and that range is exactly why pair-by-pair performance, not one blended score, is what you should check before you size a trade.
Why "Forex Prediction Accuracy" Isn't One Number
Researchers publishing in Discover Artificial Intelligence (Springer, 2025) tested machine learning models on directional forecasting — will the next candle close up or down — across eight distinct USD currency pairs. Their finding, corroborated in a companion writeup on ResearchGate: accuracy varied by pair. Not by a rounding error. Enough that a model performing well on one pair told you almost nothing about how it would perform on another.
That's the core problem with forex pair predictability as marketing copy. A provider that reports "78% accuracy" without naming the pair, the timeframe, and the test window isn't giving you a number you can act on. It's giving you the best cell in their spreadsheet. PRISM's own approach — detailed on The Model page — is to publish per-market, per-timeframe results instead of one company-wide figure.
The Most Predictable Forex Pairs, According to 2025 Data
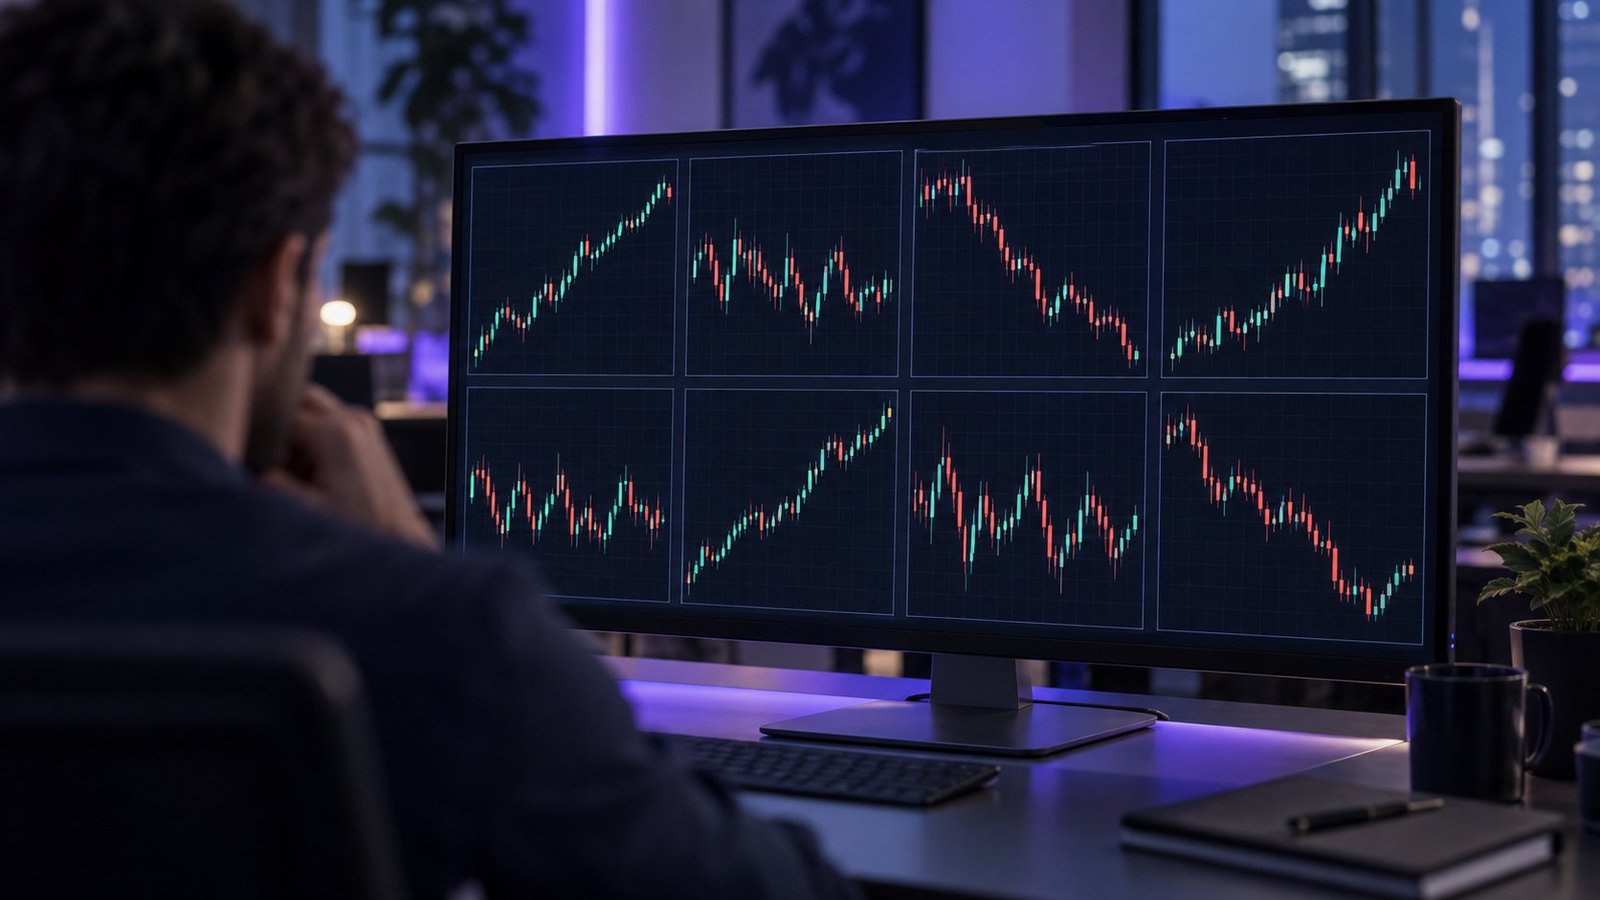
The study's central result is simple to state and easy to forget in practice: directional accuracy by currency pair is not uniform. Some pairs gave the models a cleaner signal to work with. Others sat closer to a coin flip, no matter which technique was applied. The paper doesn't hand you one grand accuracy score for "forex" — it hands you eight separate scorecards.
What Varies From Pair to Pair
- Signal-to-noise ratio — how much of a candle's move is trend versus microstructure noise
- Session overlap — how many active trading sessions influence a pair's hourly volatility
- Spread and liquidity depth, which affect how cleanly price responds to order flow
- Sensitivity to scheduled data releases versus pairs that drift on carry and rate-differential themes
Why Liquidity and Volatility Regimes Drive the Spread
Liquidity and predictability are related, but not in the direction most traders assume. Deep, heavily-traded pairs don't automatically forecast better — they behave more consistently across regimes. Thinner pairs can trend hard and predictably for weeks, then whip through a low-liquidity session and break every recent pattern. A model trained across both regimes without separating them ends up with an accuracy figure that's an average of two very different behaviors.
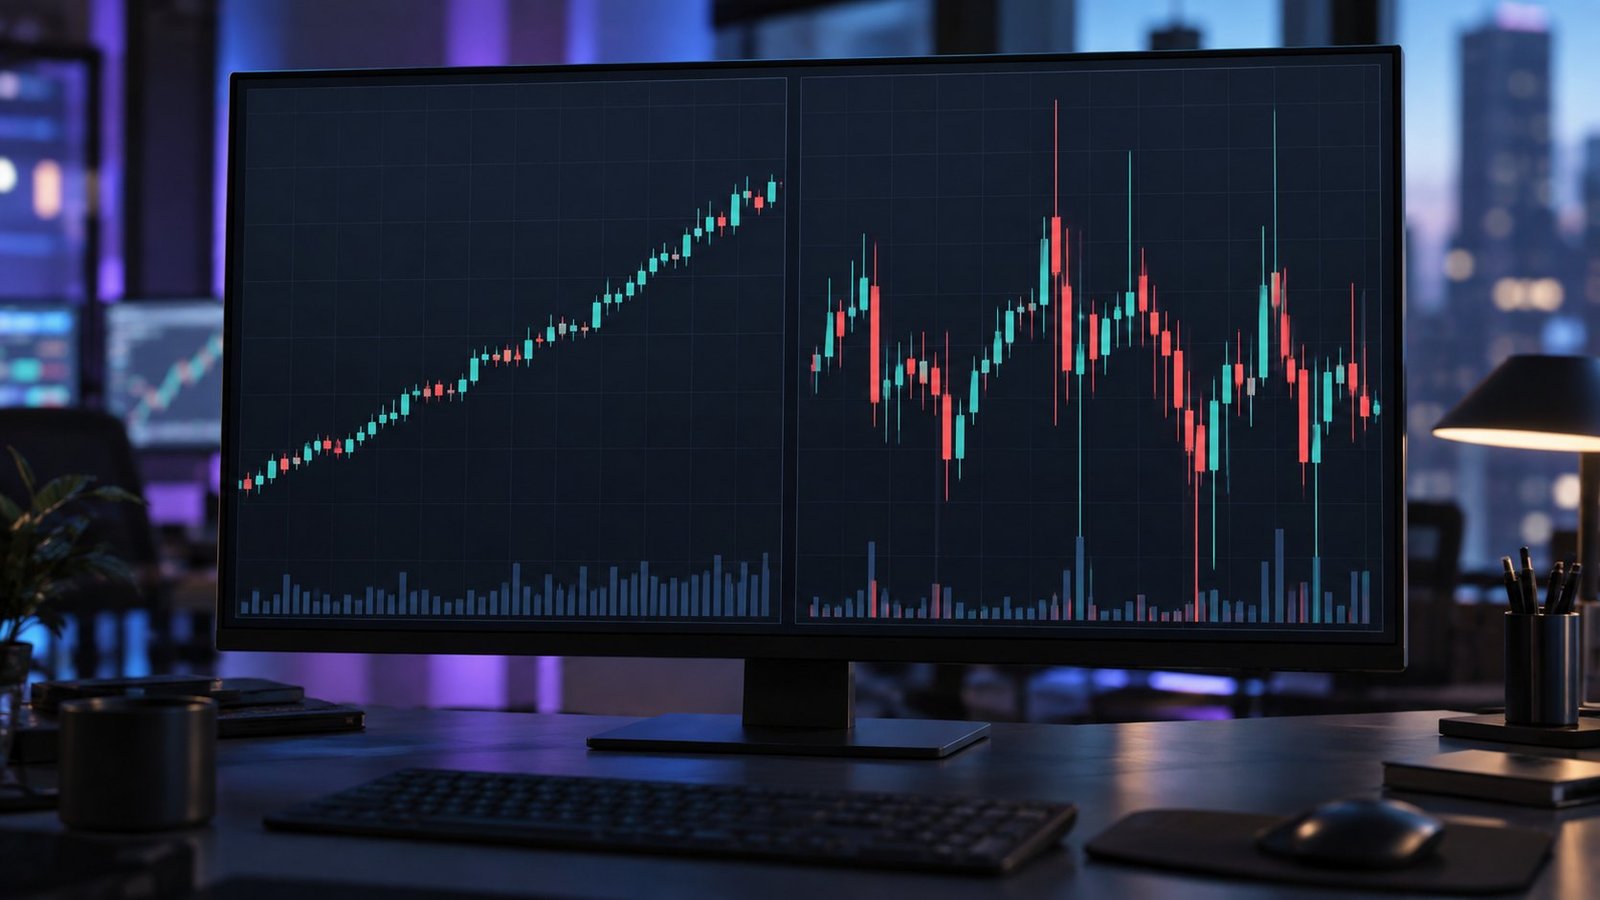
Volatility regime matters as much as the pair itself. A pair that's easy to call directionally during a stable rate environment can turn unpredictable the moment conditions shift. That's a separate topic from this post — we're not covering specific rate-decision events here — but it's why any accuracy number needs a stated test window attached to it, not just a pair name.
The Hardest Currency Pairs to Forecast — And What That Means for You
The flip side of forex pair predictability is knowing which pairs resist it. The hardest currency pairs to forecast tend to share traits: lower average daily volume relative to the majors, wider typical spread in pips, and a higher share of price action driven by news gaps rather than gradual order flow. None of that makes a pair untradeable. It means directional models — PRISM's included — need a wider confidence band and a shorter horizon on those pairs to stay useful.
In practice, this is why we publish forecasts per market and per timeframe instead of one PRISM-wide score. A trader watching a major on H1 and a trader watching a cross on H4 are looking at two different reliability profiles, even inside the same product.
See also: News impact on forex forecast
What to Ask Any Forecast Provider Before You Trust a Pair
An AI forex forecast accuracy comparison is only useful if it's specific. Before you size a position off anyone's model — PRISM included — ask for numbers that match the trade you're actually placing.
- Which pair, exactly? A blended "forex accuracy" figure across all pairs is not a per-pair number.
- Which timeframe — M15, H1, H4, or D1? Accuracy on one horizon rarely transfers to another.
- Over what test window, and how many candles? A short sample from a quiet month isn't a track record.
- How often is the forecast re-anchored? A forecast issued once a day ages differently than one re-anchored every 15 minutes.
- Is the reported figure directional accuracy, a hit rate on OHLC range, or something else? These aren't interchangeable.
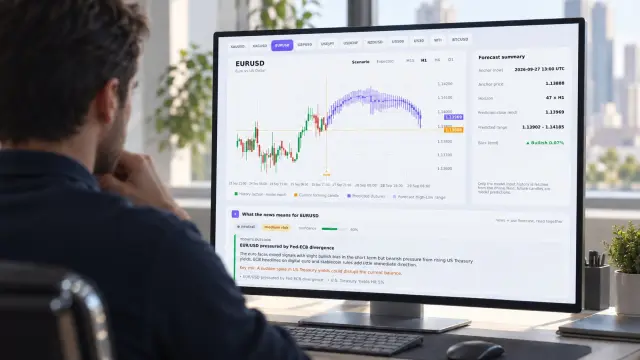
You can check this directly rather than take a provider's word for it. Compare a major like EUR/USD against a cross or a metal side by side on the Live Forecast page, or pull per-pair, per-timeframe history through the API if you want it in your own backtest →
See also: How to Evaluate a Forex Prediction API
FAQ
Is EUR/USD more predictable than a cross pair like AUD/CAD?
Not automatically. The 2025 study found accuracy varies by pair, not by pair type. A major's higher liquidity gives it more consistent behavior, but that's not the same as higher directional accuracy on every timeframe. Check the specific pair and timeframe rather than assume majors always win.
Does a longer timeframe always improve accuracy?
No. Longer candles smooth out noise, which helps some pairs and hides real trend changes in others. Compare H1 and H4 on the same pair before assuming a higher timeframe means higher accuracy — it's pair-dependent, the same way overall predictability is.
How often should I re-check a pair's accuracy numbers?
Volatility regimes shift, so a stale accuracy figure can mislead you within weeks. PRISM re-anchors every 15 minutes for that reason — the forecast reflects current conditions, not a backtest from three months ago.
Compare the Most Predictable Forex Pairs Yourself
The most predictable forex pairs will keep changing as regimes shift, which is exactly why a single accuracy claim should make you suspicious rather than confident. Ask for the pair, the timeframe, and the window. Then check it yourself. PRISM's Live Forecast page runs independent 48-hour OHLC forecasts across all 11 covered markets and 4 timeframes, re-anchored every 15 minutes, so you can compare a pair's behavior directly instead of trusting a blended number. Forecasts are model output, not financial advice — treat every accuracy figure, including ours, as a starting point for your own risk decisions, not a guarantee →