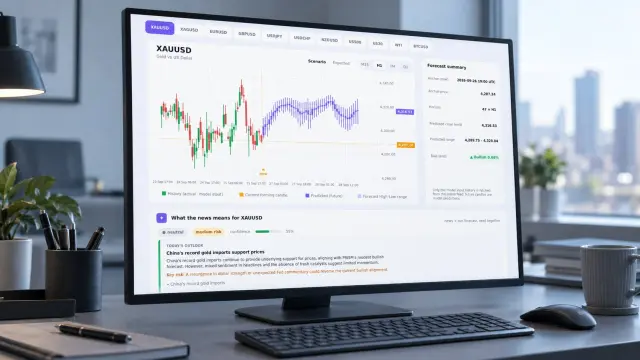
A forex prediction range forecast gives you more usable information than a single target. It separates the expected open, high, low, and close across a defined horizon. That matters when your chart moves through several prices before the forecast window ends.
Recent institutional outlooks make the distinction clear. BNP Paribas revised its three-month EUR/USD target to 1.16 and kept its 12-month target at 1.20. ING lists EUR/USD at 1.15 for one month and 1.16 for three months. ING also describes USD/JPY in a possible 155–160 range. These are conditional views, not precise promises.
Why a single forex target is incomplete
A point target answers one narrow question: where might the exchange rate be at a stated future date? It does not describe the path. EUR/USD can trade above and below that level before the horizon closes. A target can still be useful, but only when you attach a timeframe, directional bias, and reason for invalidation.
BNP Paribas provides a good example. In Currencies Focus - September 2026, it sets EUR/USD at 1.16 for three months and 1.20 for 12 months. ING’s G10 FX Talking: Dollar downtrend delayed lists 1.15 for one month and 1.16 for three months. The difference is not a contradiction. The institutions use different horizons, assumptions, and publication dates.
Read those numbers as conditional coordinates. They express a view under a particular information set. A new rate decision, inflation release, intervention risk, or change in positioning can alter the path. The target does not tell you the expected intraday low, the expected high, or the likely closing behavior.
What to record beside every target
- Direction — bullish, bearish, or broadly range-bound.
- Horizon — one month, three months, 12 months, or a defined number of hours.
- Reference price — the market level used when the forecast was published.
- Invalidation — the condition that would make the underlying view less useful.
- Expected movement — a point, a band, or an OHLC sequence.
This framework changes the question you ask. Instead of asking whether EUR/USD will hit 1.16 exactly, ask whether the direction, horizon, expected range, and invalidation still match your setup. That is the practical difference between reading a target and analyzing a forecast.
Forex prediction range forecast: read the four fields
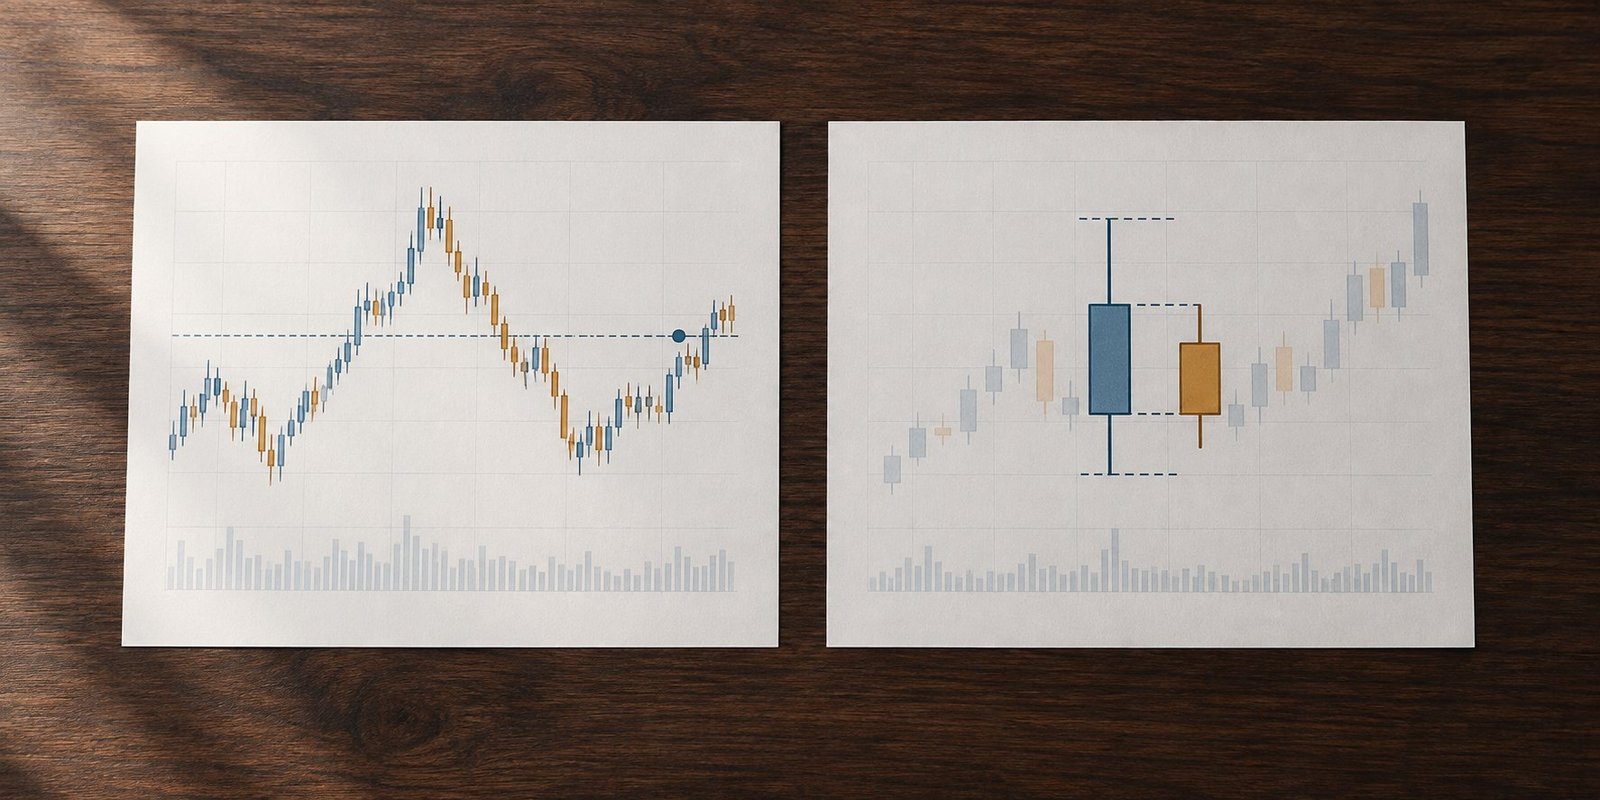
An OHLC forecast describes four prices for a future candle or forecast window. Open is the expected starting reference. High is the projected upper excursion. Low is the projected lower excursion. Close is the projected ending reference. Together, they describe a possible path rather than one isolated destination.
A forex OHLC forecast is not automatically more accurate than a point target. It is more informative about structure. You can compare the projected high and low with your chart, estimate whether the range is narrow or wide, and see whether the close supports the directional bias. The output still remains model output, not financial advice.
The useful unit is the forecast window. A 48-hour range has a different meaning from a three-month institutional target. The shorter forecast reacts to current market structure and recent candles. The longer target compresses many possible paths into one reference level. Mixing them creates false precision.
How to compare a point target with an OHLC range
- Normalize the horizon. Convert both views into the same period before comparing prices.
- Compare direction first. A lower close or lower target suggests a different bias from a higher close or higher target.
- Compare the width. A 155–160 USD/JPY range communicates uncertainty that a single 158 target hides.
- Check the path. The high and low show whether your planned entry sits inside the expected movement.
- Write down invalidation. A forecast loses context if you cannot state what would make it less relevant.
ING’s USD/JPY example shows why range thinking helps. Its possible 155–160 range does not claim that every price inside the band is equally likely. It says the market may remain bounded across the stated period, with risks distributed around a wide scenario. That is different from treating 157.50 as a promised endpoint.
The same logic applies to a forex price range prediction. You should ask whether the band is wide because the horizon is long, because the market is volatile, or because the underlying view is conditional. Range width is information. It is not a confidence score by itself.

See also: Forecast accuracy backtest forex
How PRISM presents a 48-hour OHLC forecast
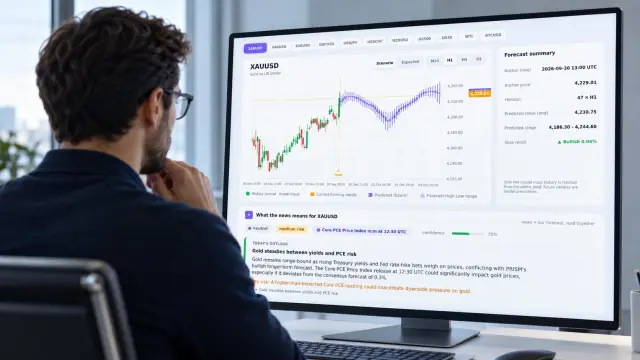
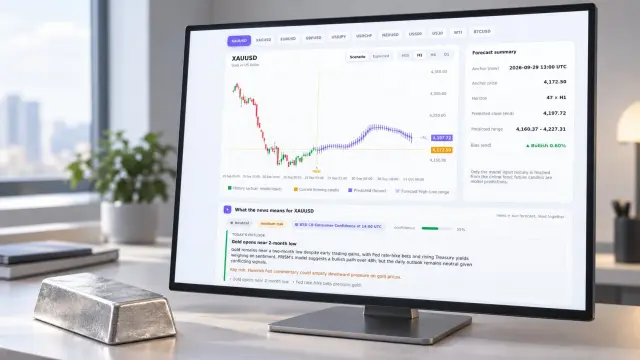
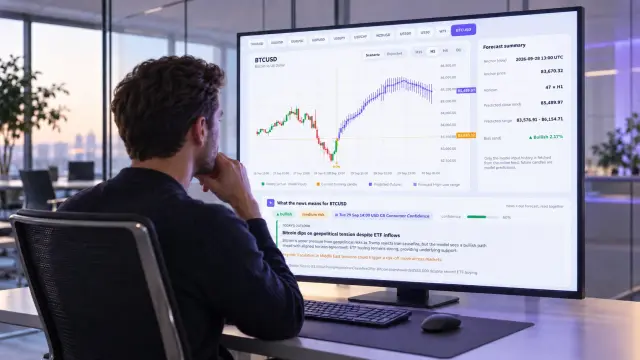
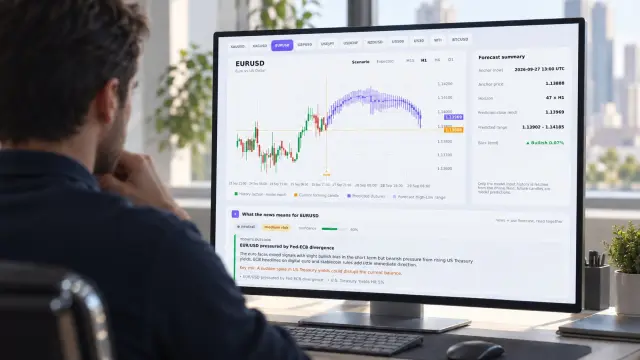
PRISM Forecasting covers 11 markets with 48-hour OHLC candle forecasts across M15, H1, H4, and D1. Those four views do not replace an institutional multi-month target. They answer a different operational question: what could the next 48 hours look like across several candle sizes?
Consider this anonymized teaching example. It is illustrative, not a live signal. On M15, the projected candle might open at 1.1600, reach 1.1612, dip to 1.1594, and close at 1.1606. On H1, the same horizon could show 1.1600, 1.1620, 1.1588, and 1.1608. H4 might show 1.1600, 1.1635, 1.1575, and 1.1615. D1 might compress the view to 1.1600, 1.1640, 1.1560, and 1.1610.
The numbers are not four promises. They are four resolutions of the same forecast window. M15 exposes shorter swings. H1 gives a broader intraday frame. H4 filters some noise. D1 shows how the 48-hour view may appear in daily candles. You can compare the fields without pretending that every timeframe carries identical uncertainty.
This is also where PRISM differs from forex forecast targets published for one month, three months, or 12 months. An institutional target helps you frame a macro scenario. A PRISM range helps you organize the next candles. One is not a substitute for the other.
What 15-minute re-anchoring changes
PRISM re-anchors its live forecast every 15 minutes. A fresh candle can change the reference open, projected high, projected low, or expected close. The forecast is therefore conditional on the latest anchor. It should be read as a current estimate, not a fixed chart annotation.
Suppose the M15 candle closes near its projected high. The next refresh may shift the range upward because the market has already used part of the earlier path. If price instead breaks below the projected low, the next forecast may reflect a different structure. Neither update proves certainty. Each update tells you how the current model output has changed.
For this reason, save the timestamp when you review a live forecast. Compare the new OHLC fields with the previous snapshot. Focus on whether the direction, range width, and close location remain consistent. This prevents you from treating a moving forecast as if it were a static institutional target.
You can view the current Live Forecast directly, or use the MT5 Indicator when you need the ranges beside your chart. The REST API provides the same type of forecast data for a workflow that records timestamps and revisions.
See also: Exchange rate forecast
A practical reading method for your chart
Start with the close. A projected close near the high supports a different interpretation from a close near the low. Then inspect the distance between high and low. A wide range may suit scenario planning but provide weak precision for a narrow entry decision.
Next, place your own chart level inside the forecast. If your level sits outside the projected range, the setup conflicts with the current model output. If it sits near the projected high or low, the forecast suggests a possible boundary rather than a guaranteed turning point.
Use a simple comparison table in your notes. Record the source, publication time, horizon, direction, range, close, and invalidation. For example, BNP Paribas may supply a three-month EUR/USD point target of 1.16. ING may supply a one-month view of 1.15. PRISM may supply a 48-hour OHLC sequence. Keeping the horizons separate prevents a false ranking of forecasts.
- Point target — useful for a destination at a stated horizon.
- Range target — useful for expected boundaries and scenario width.
- OHLC forecast — useful for candle structure within a shorter window.
- Re-anchored live forecast — useful for tracking how the current estimate changes.
Do not turn the numbers into a trade recommendation by themselves. A forecast can help you define scenarios, but it cannot remove spread, execution uncertainty, gap risk, or the possibility that the market leaves the modeled range. Size your decision around uncertainty, not around the appearance of precision.
FAQ: forex prediction range forecast
Is an OHLC forecast better than a single target?
It provides more structure, not guaranteed accuracy. OHLC fields show a possible path and closing position. A single target gives you one reference level.
Why do institutional targets differ?
Institutions can use different publication dates, horizons, assumptions, and reference prices. BNP Paribas and ING therefore can show different EUR/USD targets without addressing the same forecast window.
How should you read a 155–160 USD/JPY range?
Treat it as a conditional scenario band. It describes possible boundaries over the stated period. It does not assign equal probability to every price inside the band.
What does 15-minute re-anchoring mean?
It means the live forecast updates its reference as new 15-minute candles arrive. Review the timestamp and compare revisions instead of treating one snapshot as permanent.
Use the forecast as a conditional map
A point target, a range, and an OHLC forecast each compress uncertainty in a different way. BNP Paribas’s EUR/USD targets, ING’s EUR/USD levels, and ING’s 155–160 USD/JPY range show why horizon and conditions matter. PRISM adds a shorter 48-hour view through M15, H1, H4, and D1 candles, re-anchored every 15 minutes.
Read the direction, expected range, timeframe, close location, and invalidation together. Treat every output as model information, not financial advice or a promise of profit. For the current range-based view, open the Live Forecast for 48-hour OHLC projections across four timeframes →