Forex volatility position sizing usually runs backward. You measure average true range over the last 14 bars, size a stop against it, and trade — but ATR only reports how wide the market has already been. It says nothing about how wide it's about to get. That gap costs the most right when volatility is expanding, before the wider ranges have pulled the trailing average up with them.
This post walks through the standard ATR sizing formula and the 1-2% risk cap it's built on, where that method breaks down under 2026 conditions, and how reading a forward-looking forecast range — instead of only a trailing average — lets you handle forex volatility position sizing before the drawdown, not after it.
The ATR Position Sizing Forex Formula, and Its Blind Spot
Alphaexcapital.com lays out the volatility-based model plainly: position size equals your dollar risk divided by the ATR-based stop distance in money per lot. Risk 1% of a $10,000 account and you're risking $100 — full stop. The percentage doesn't move. The lot does. A wider ATR stop shrinks the lot; a tighter one lets it grow. That's the rule alphaexcapital.com summarizes as higher volatility, smaller size, and it's why the same $100 risk survives both a quiet EUR/USD range and a loud GBP/JPY session. Most versions of the formula multiply raw ATR by 1.5 to 3 before using it as the stop distance, tighter for scalps, wider for swing trades.
ATR position sizing forex traders rely on is only as current as its lookback. Wilder's original design averages the last 14 true ranges, so it reports where volatility was over roughly the past two to three weeks on a daily chart, or the past few hours on an H1 chart. That's useful for describing normal conditions. It's the wrong tool for catching the moment conditions stop being normal.
Forex Risk Per Trade 2026: The Stop-Widens-Lot-Doesn't Trap
fxnx.com's 2026 guidance flags a specific failure mode. A trader widens the stop when volatility picks up, to keep the trade from getting stopped out by noise, but leaves the lot size untouched. Triple the stop distance without cutting the lot to a third, and a single hit costs three times the intended risk. The forex risk per trade 2026 traders are told to hold — still 1-2% of equity — only works if the lot gets recalculated every time the stop changes, not just when the position is first opened.
This is a sizing failure, not a strategy failure. The stop was placed correctly. The lot just never caught up to it. It shows up most often after a trader manually widens a stop mid-session to avoid an obvious whipsaw, then forgets the position was sized for the old, tighter stop.
Reading PRISM's Forecast Range as a Forward Volatility Signal
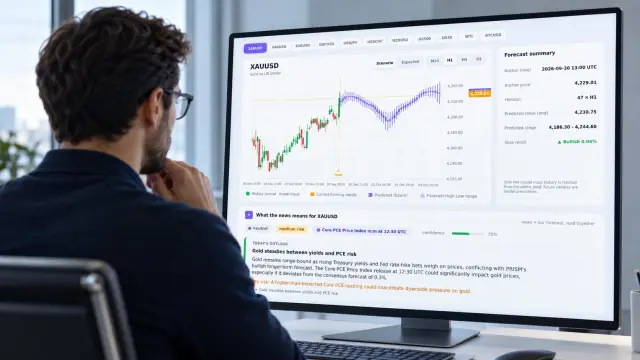
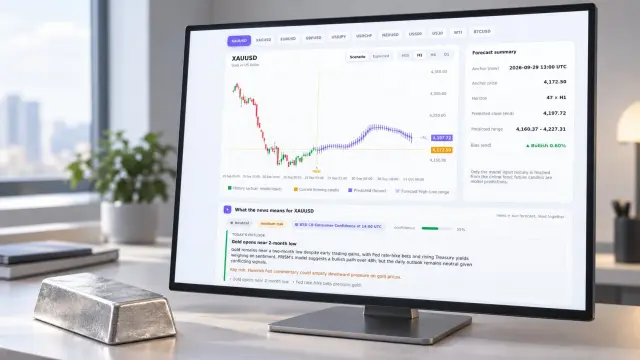
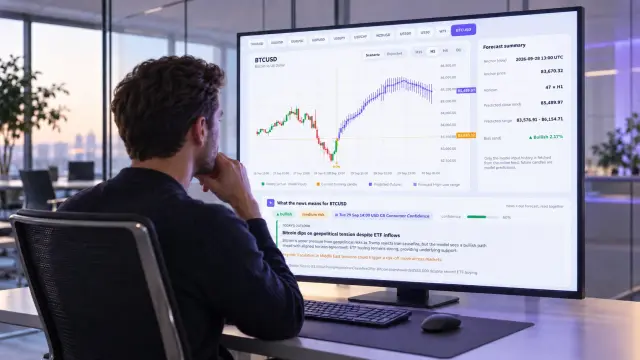
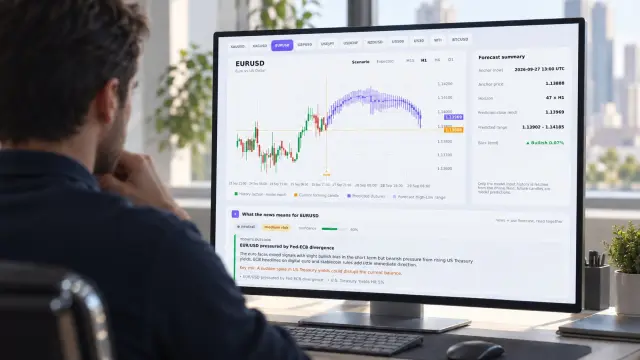
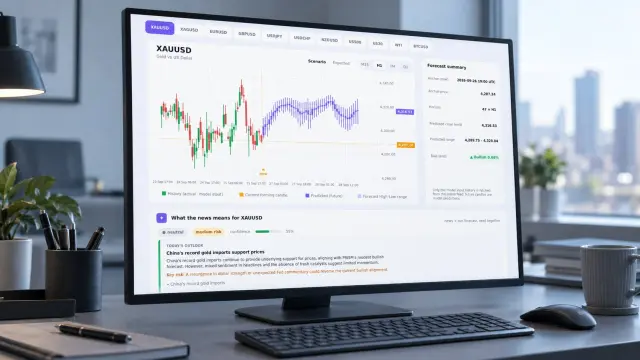
PRISM's 48-hour OHLC forecast re-anchors every 15 minutes across four timeframes — M15, H1, H4, and D1 — and each re-anchor carries its own implied high-low range. That range is forward-looking by construction. It's the model's read on where price is likely to travel next, not an average of where it already went. Forecast range position sizing means treating that implied range as a forward substitute for ATR, or at minimum a cross-check against it, before you set the lot.
The signal worth watching is a re-anchor where the implied range widens noticeably against the last few re-anchors, ahead of realized price actually moving that much. Trailing ATR won't reflect that expansion until enough new bars close to pull the 14-period average up, often a full session behind. A widening forecast range can flag the same shift several re-anchor cycles earlier, while ATR is still reporting the calmer period behind it. That's forex volatility position sizing looking forward instead of back.

See also: Forecast accuracy backtest forex
A Walk-Through: From Forecast Range to Lot Size
Here's the sequence, without inventing specific numbers — pull your own range from the current forecast and run the math against your account.
- Open the forecast for your pair and timeframe and note the implied high-low range for the next 48 hours, not just the single projected close.
- Compare that range to your trailing ATR stop distance. If the forecast range is meaningfully wider, treat the forecast figure as your working stop distance instead.
- Recalculate: position size equals account equity times risk percentage, divided by the stop distance in pips times pip value. Plug in the wider, forecast-derived stop.
- Recheck at the next re-anchor. If the range narrows back, the expansion may already be priced in and the lot can step back up.
None of this requires abandoning ATR. It requires reading two numbers side by side before you size the trade, and letting the wider of the two set the stop distance you divide by. In practice the forecast range mostly agrees with ATR — but on the sessions where they diverge, the forecast is the one that saw the move coming.
Pulling the range manually from the Live Forecast page works at the desk; the MT5 Indicator puts the same range on your chart next to price, and the API lets you pull it into a sizing script so the recalculation in step three happens automatically.
See also: News impact on forex forecast
Forex Volatility Position Sizing: Frequently Asked Questions
Does the forecast range replace ATR entirely?
No. Treat it as a cross-check. ATR is well understood and easy to automate; the forecast range adds a forward view on top of it, and the wider of the two should set your stop distance.
How often should I recheck my lot size against the forecast?
At minimum, at every re-anchor for the timeframe you trade — PRISM re-anchors every 15 minutes. If you hold a position across several re-anchors, check whether the range has widened enough to warrant trimming size.
Does a wider forecast range promise a bigger move?
No. It's model output, not financial advice — a probability-weighted range, not a promise. Hit rates vary by pair and timeframe, and you should size as if the range could be wrong in either direction.
Does this apply if I trade fixed lot sizes?
Fixed lots ignore volatility by design, so a widening forecast range is exactly the kind of signal that should push you toward volatility-based sizing, at least temporarily, for that trade.
Forex Volatility Position Sizing: Size to What's Coming
ATR tells you what the market already did. A forecast that re-anchors every 15 minutes across four timeframes gives you a read on what it's likely to do next, and that's the number that should shrink your lot before a widening stop costs you three times the plan. Pull up the current implied range on the 48-hour forecast before you size your next trade, and run it against your ATR stop side by side.