Bitcoin weekend volatility is lower on average but harder to model at the tails: CME measured 2.33% weekend volatility versus 3.10% on weekdays, while Cipher Intelligence found a 1.58% weekend daily range versus 3.40% on weekdays. Your forecasting problem is re-anchoring the 48-hour path as Friday flows fade and Monday liquidity returns.
Average weekend statistics do not tell you when a rolling OHLC forecast becomes stale. This PRISM validation frame follows the same BTCUSD forecast across Friday, Saturday, Sunday, and Monday, then tests whether the ±σ band contains realized M15 movement. That calendar transition is the gap left by pages that stop at volume and average range.
What does bitcoin weekend volatility actually measure?
Bitcoin weekend volatility is usually lower than weekday volatility, but the distribution is narrower only until a large order or headline reaches a thin book. CME Group reports average weekend volatility of 2.33% versus 3.10% on weekdays. Its weekend median is 1.91% versus 2.66%, with a 1.21%–2.91% interquartile range.
| Evidence | Weekend result | Weekday comparator | Use in your process |
|---|---|---|---|
| CME Group average volatility | 2.33% | 3.10% | Set the baseline range expectation |
| CME Group median volatility | 1.91% | 2.66% | Separate a normal weekend from a tail event |
| CME Group weekend interquartile range | 1.21%–2.91% | Not supplied in the cited summary | Check whether realized movement is outside the central weekend distribution |
| Cipher Intelligence BTC perp volume | $1.08 billion per weekend day | $2.75 billion per weekday | Treat lower flow as a depth constraint |
| Cipher Intelligence average daily range | 1.58% | 3.40% | Set a range prior without assuming direction |
Cipher Intelligence’s September 2026 Hyperliquid sample shows the same structure from a different market. Weekend BTC perp volume averaged $1.08 billion per day against $2.75 billion on weekdays. Average daily range was 1.58% against 3.40%. Friday and Monday were the most volatile days, so the transition matters more than the calendar label alone.
Glassnode’s October 5 BTC Market Pulse provides a live example of the tail risk. A Sunday rally lifted the weekly close by about 2%. That observation supports a wider uncertainty allowance, not a directional rule. Weekend trading can be quiet in aggregate and still define the next market regime.
Does CME bitcoin 24/7 remove bitcoin weekend gap risk?
No. CME bitcoin 24/7 changes venue continuity, but it does not remove thin-book risk. A derivatives venue that trades through Saturday and Sunday can distribute price discovery across the weekend instead of concentrating it at a Monday reopen. Depth can still vary sharply across venues and timeframes.
- CME’s move toward 24/7 cryptocurrency derivatives reduces a discrete venue-close discontinuity.
- Lower weekend flow can make a liquidation move price farther before counterparties refill the book.
- A headline can invalidate the forecast before the next scheduled re-anchor.
- Your bitcoin weekend gap risk is therefore a model-staleness problem as well as an execution problem.
For bitcoin weekend trading, separate the calendar effect from the forecast effect. A quieter median range should not narrow your band mechanically if the Friday anchor carries a large move into Saturday. If a cross-asset reopening affects your scenario, the Gold price prediction audit is a useful comparison for how a closed home market can distort a rolling path.
How should a 48-hour forecast cross Friday to Monday?
A rolling forecast should re-anchor every 15 minutes while preserving the same 48-hour endpoint. PRISM scores 192 M15, 48 H1, 12 H4, and 2 D1 candles from each anchor. The comparison must use the same rules for Friday, Saturday, Sunday, and Monday so calendar effects are not confused with horizon effects.
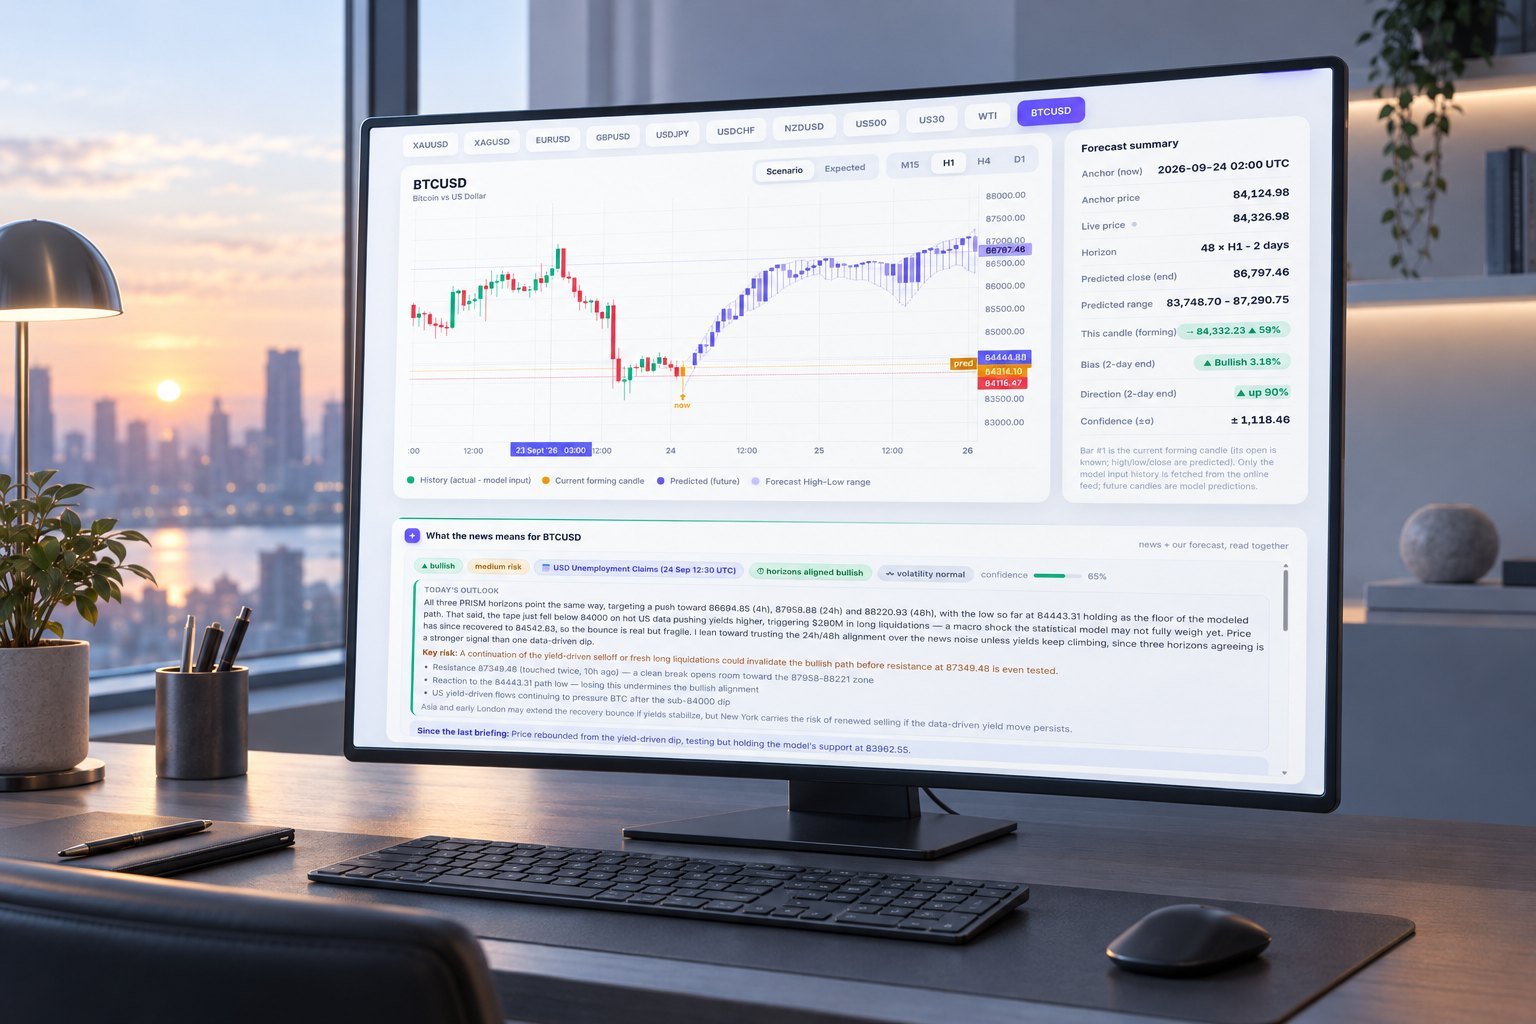
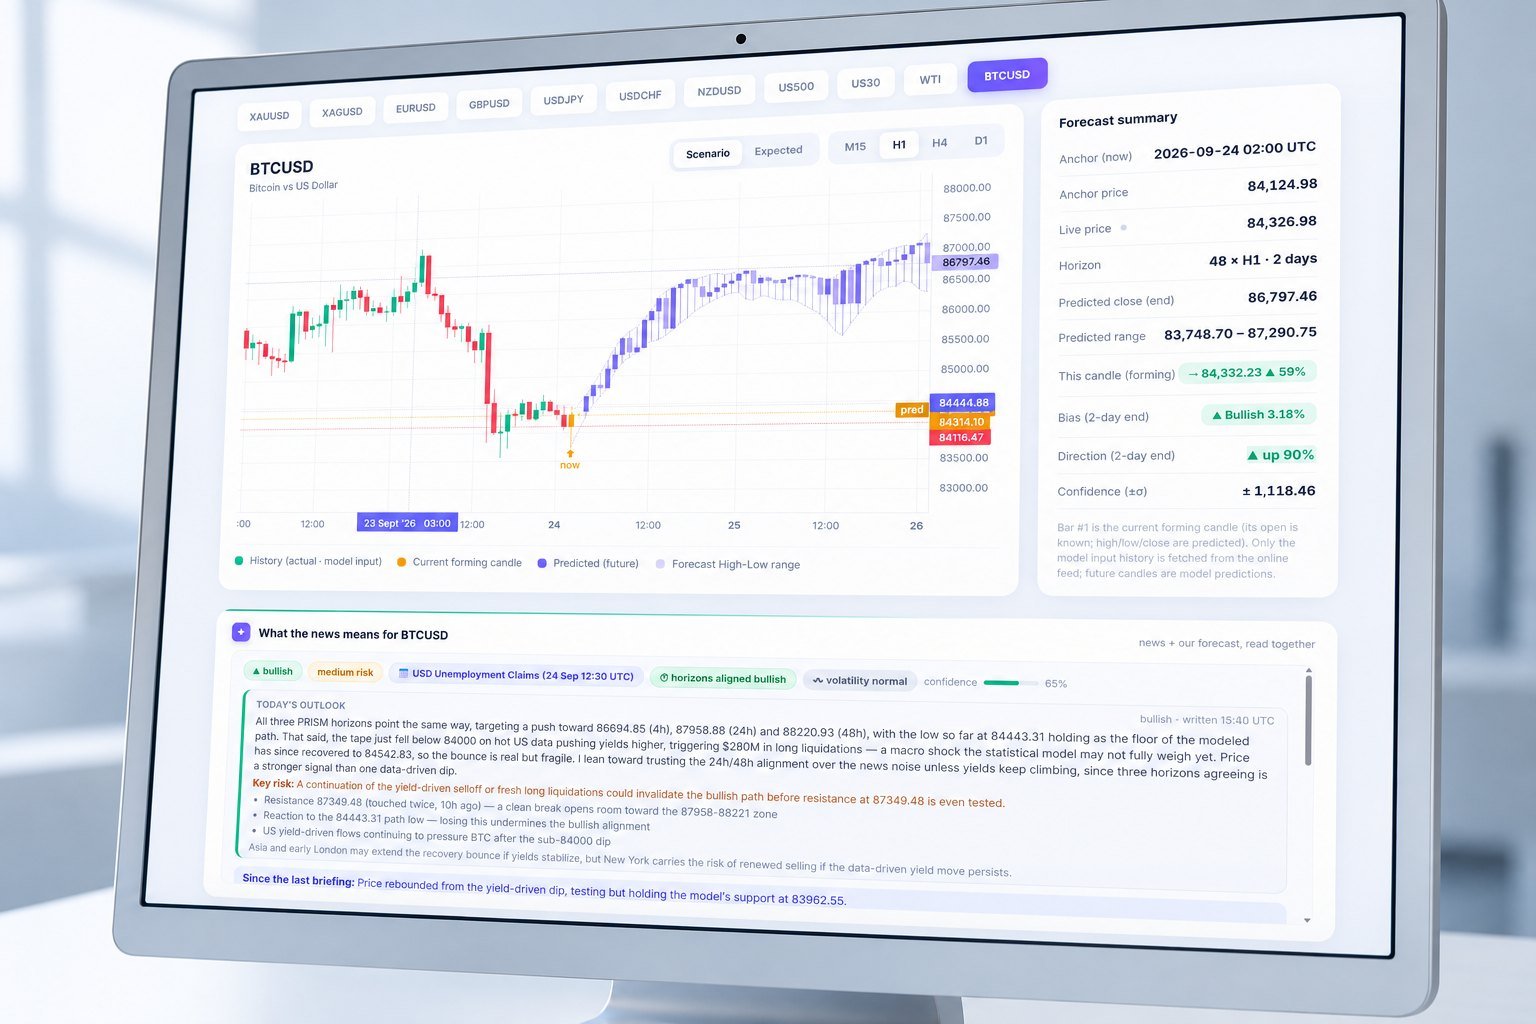
The supplied BTCUSD screen shows the intended product view: an anchor price of 84,124.98, a 48 × H1 horizon, a predicted end close of 86,797.46, and a predicted range of 83,748.70–87,290.75. That is a forecast snapshot, not the four-day realized-versus-forecast export required to calculate daily validation metrics.
| Anchor day | MAE in USD | Range coverage | Median high-low range | Decision use |
|---|---|---|---|---|
| Friday | Not included in supplied validation export | Not included in supplied validation export | Not included in supplied validation export | Test the pre-weekend anchor |
| Saturday | Not included in supplied validation export | Not included in supplied validation export | Not included in supplied validation export | Test thin-book behavior |
| Sunday | Not included in supplied validation export | Not included in supplied validation export | Not included in supplied validation export | Test headline and late-weekend sensitivity |
| Monday | Not included in supplied validation export | Not included in supplied validation export | Not included in supplied validation export | Test the liquidity transition |
MAE in USD should measure the average absolute difference between each forecast close and the realized close. Range coverage should measure the percentage of realized high-low outcomes contained by the forecast high-low band. Median high-low range should use the realized candle range in USD. The supplied materials do not contain those four daily values, so they should not be invented for publication.
This is where the PRISM workflow differs from a weekend average. The hourly AI briefing reads market news against the forecast, while the same 48-hour OHLC structure runs across 11 markets and four timeframes. The MT5 indicator and REST API expose the forecast, but the re-anchor rule remains the control that keeps Friday-to-Monday comparisons valid.
When does the PRISM uncertainty band fail?
The named failure mode is a thin-book liquidation or an unexpected weekend headline. Trigger it when the realized M15 range exceeds the forecast ±σ band. That condition does not prove the model is wrong; it identifies a realized move outside the model’s current uncertainty envelope.
- Re-anchor the forecast every 15 minutes. Failure mode: a stale Friday anchor remains active after weekend price discovery changes.
- Score the 192 M15 candles and their nested 48 H1, 12 H4, and 2 D1 candles. Failure mode: mixing horizons creates false coverage results.
- Compare each realized M15 high-low range with the forecast ±σ band. Failure mode: a thin-book liquidation or headline produces an outside-band candle.
- Record the event separately from ordinary error. Failure mode: averaging a tail breach into MAE hides the condition that matters for live monitoring.
PRISM’s forecast guidance defines the end-close interval as the model’s 10th to 90th percentiles. Its nominal 80% coverage is not calibrated, so it is not an 80% probability of a correct trade. For broader context on liquidity-driven uncertainty, the bitcoin price discussion is the next useful layer.
FAQ: bitcoin weekend volatility and forecast bands
Why can weekend volatility be lower but still dangerous?
Lower average range does not guarantee stable execution. Cipher Intelligence measured less weekend volume and a smaller average range, while thin liquidity can amplify a liquidation or headline.
What does range coverage tell you?
Range coverage tells you how often realized candle extremes stayed inside the forecast high-low band. It tests containment, not profitability or trade accuracy.
Should the Monday forecast reuse Friday’s anchor?
No. Re-anchor every 15 minutes. Monday can carry a different volume and volatility regime, so a Friday-issued band may no longer describe current conditions.
How should you use bitcoin weekend volatility?
Use weekend averages as a prior, then let realized M15 behavior decide whether the band still describes the market. For a live check of the current price of bitcoin, compare the M15 band with the H1, H4, and D1 path. Forecasts are model output, not financial advice. →