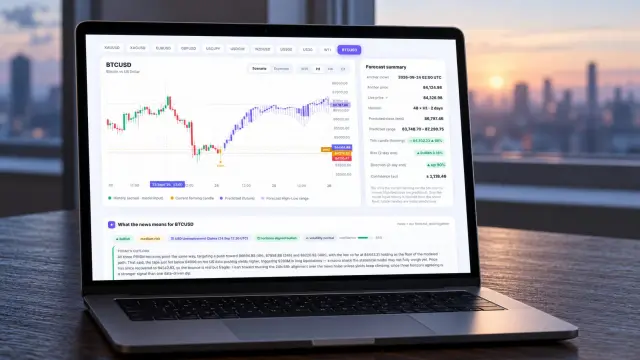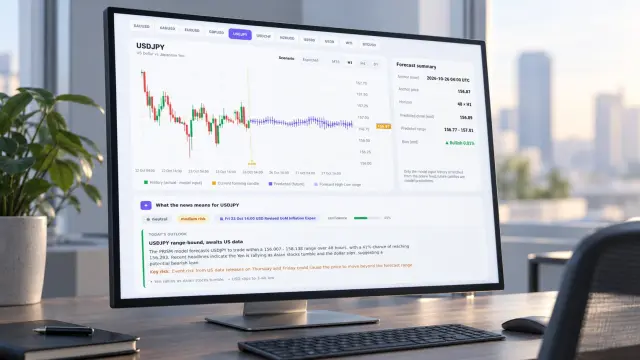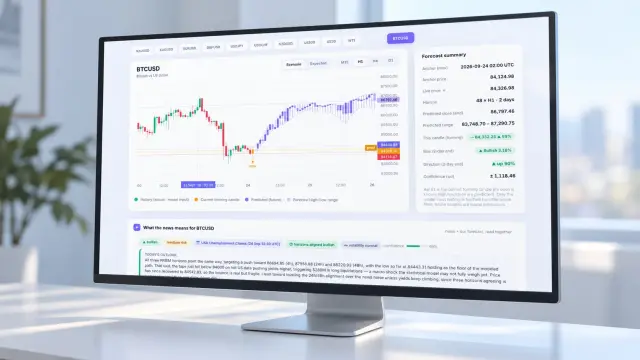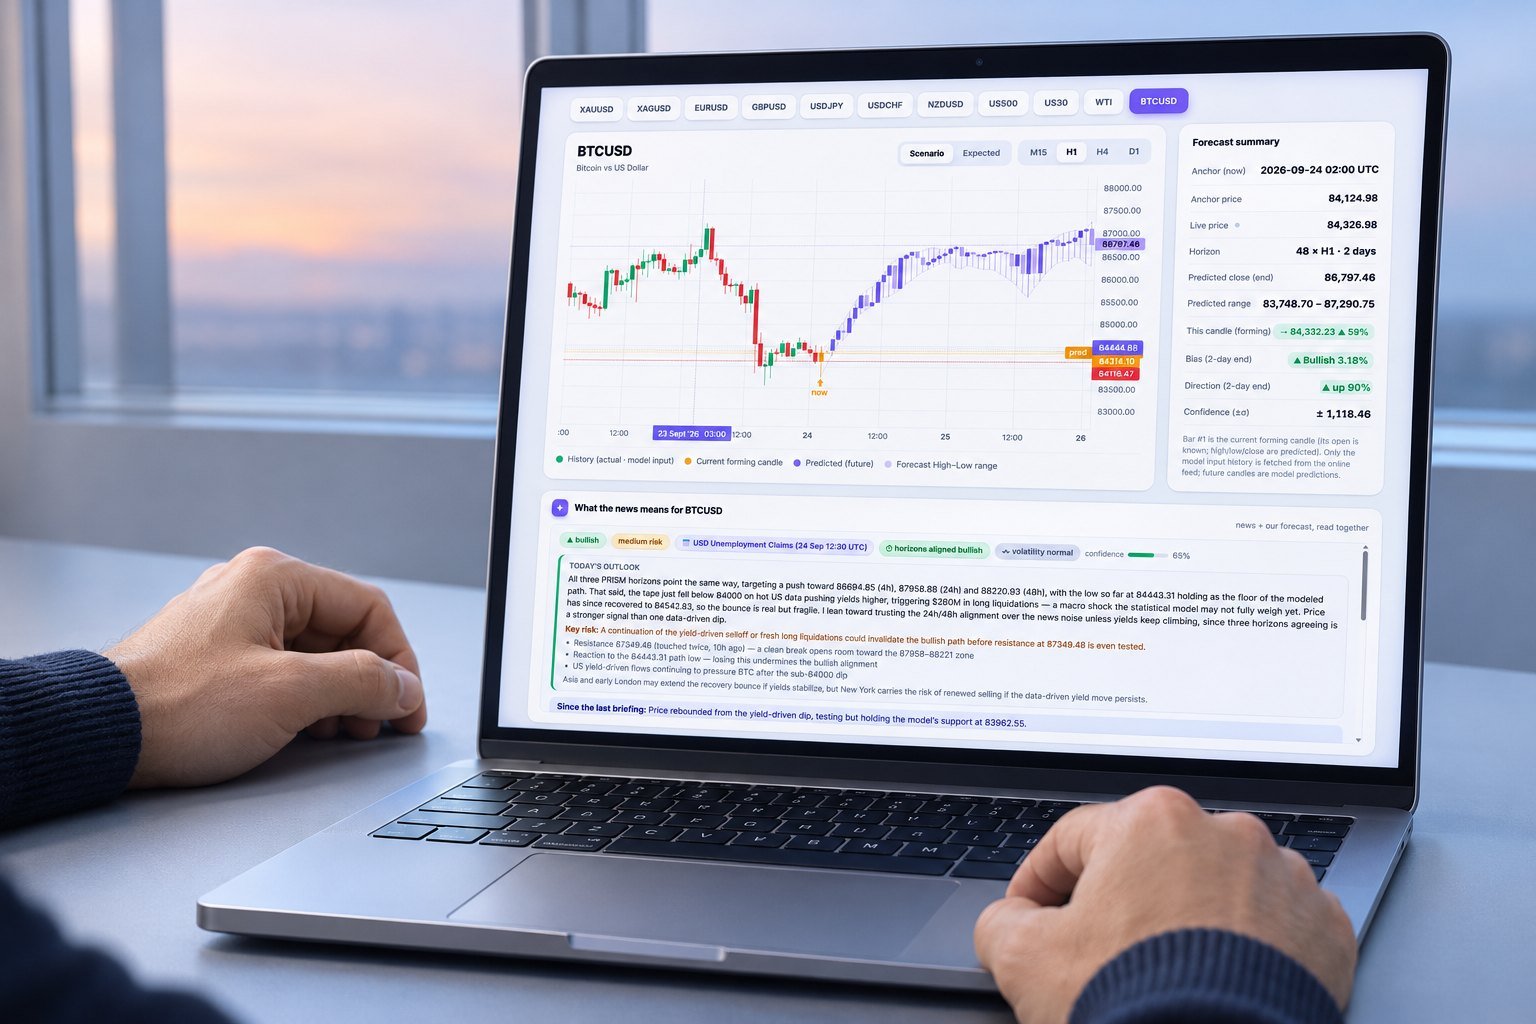
The oil futures curve is a sequence of delivery-month prices, not a single forecast. Contango means later barrels cost more; backwardation means prompt barrels cost more. To use the curve with PRISM, you calculate calendar spreads, label roll state, and condition each M15, H1, H4, or D1 OHLC horizon without treating deferred futures as promised spot prices.
That is the missing connection in most curve explainers. PRISM re-anchors every 15 minutes, so curve shape must be evaluated beside contract state, settlement timing, and forecast horizon. If you also need the broader level-versus-horizon distinction, see our oil cost forecast analysis.
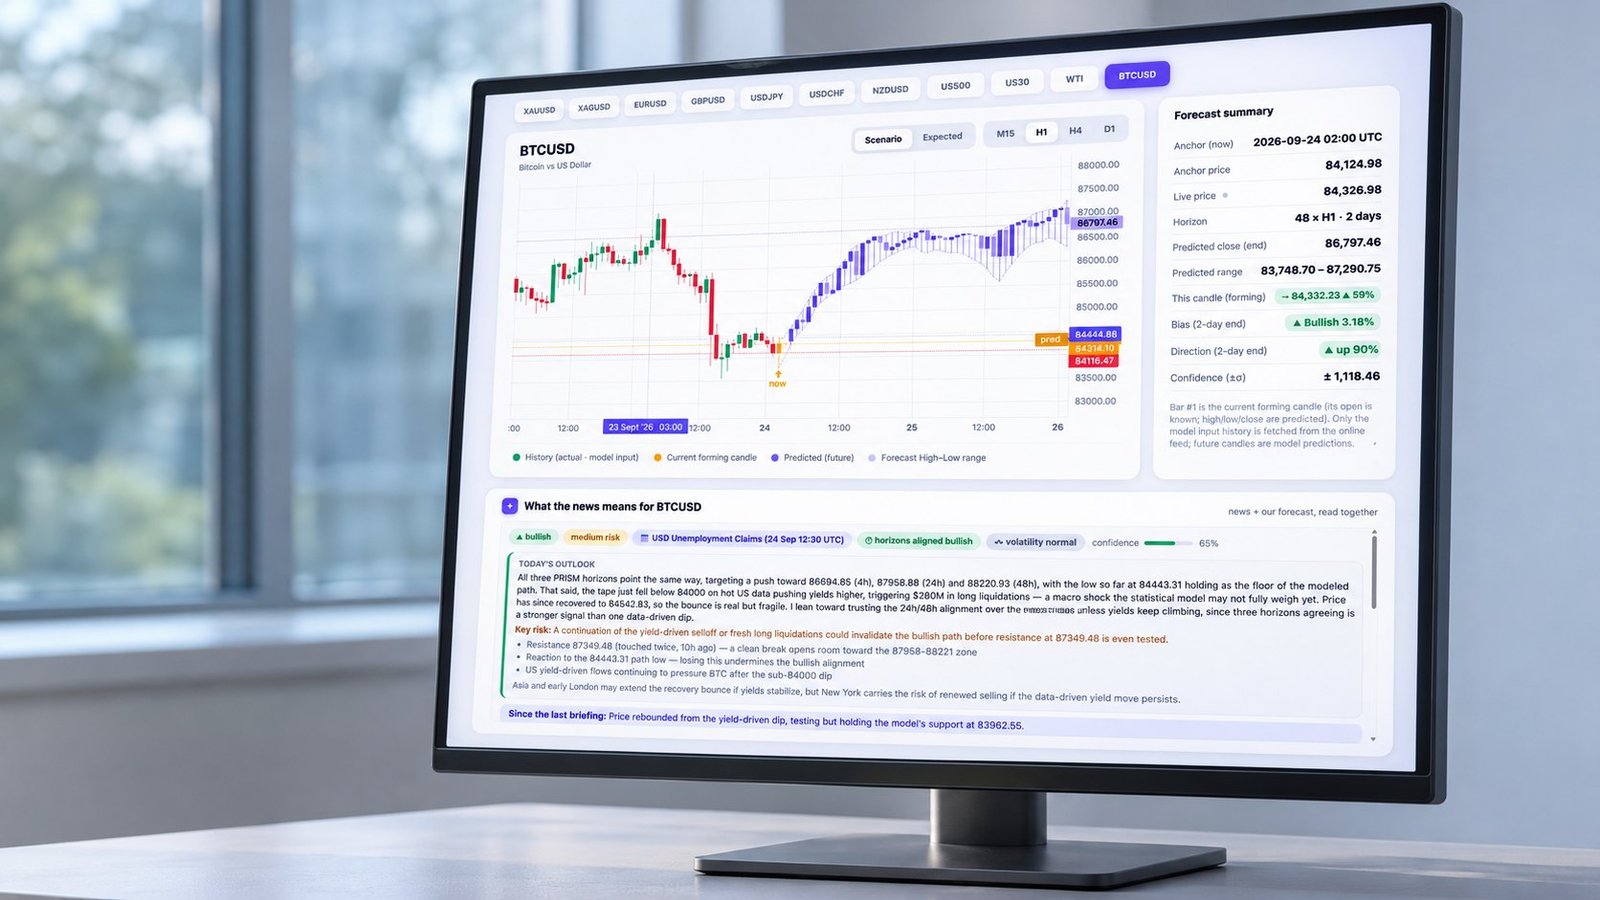
How do you calculate an oil futures curve spread?
The oil futures curve orders settlement prices by delivery month. A calendar spread is the later contract minus the earlier contract, quoted in dollars per barrel and as a percentage of the earlier contract.
Use the front month, or M1, as the nearest actively traded delivery contract. M2 is the next delivery month. M6 is the sixth contract in sequence. A positive spread indicates contango. A negative spread indicates backwardation. PetroEyes and OilDon both emphasize that the curve describes relative pricing across time, not a guaranteed path for the spot market.
| Spread | Hypothetical settlements | Dollar calculation | Percentage calculation | Model reading |
|---|---|---|---|---|
| M1–M2 | M1 $74.80; M2 $75.55 | $75.55 − $74.80 = +$0.75/bbl | $0.75 ÷ $74.80 = +1.00% | Prompt contango; check storage and roll state |
| M1–M6 | M1 $74.80; M6 $77.20 | $77.20 − $74.80 = +$2.40/bbl | $2.40 ÷ $74.80 = +3.21% | Broader carry slope; compare with financing and inventory |
| Dec–Dec | Current Dec $76.40; next Dec $78.10 | $78.10 − $76.40 = +$1.70/bbl | $1.70 ÷ $76.40 = +2.23% | Deferred tilt; do not substitute for a future spot target |
The practical oil futures curve contango backwardation distinction is the sign and location of the spread. Contango can reflect storage, financing, insurance, and available space. Backwardation can reflect prompt scarcity and the value of immediate barrels. CME connects these relationships to storage economics, financing conditions, supply disruptions, and geopolitical risk. Neither shape alone supplies a directional call.
How should the oil futures curve condition a 15-minute forecast?
The curve should condition a short-horizon OHLC model as context, not replace its candle inputs. PRISM uses a 48-hour OHLC feed across 11 markets and four timeframes, then separates curve regime, roll state, and forecast horizon before evaluating error.
- Curve regime — label contango, backwardation, or near-flat structure from settlement spreads.
- Spread vector — retain M1–M2, M1–M6, and a deferred spread instead of compressing the curve into one number.
- Roll state — record days to front-month expiry and whether the observed price is last trade or official settlement.
- Forecast horizon — evaluate M15, H1, H4, and D1 separately because the same curve signal can have different information value across horizons.
The oil curve and spot forecast are related but not interchangeable. A deferred contract contains financing, storage, supply, and risk-premium information. It does not promise that spot will equal that contract at a future date. The same regime fields can also feed PRISM’s MT5 indicator and REST API without turning them into trading advice.
Why does horizon change the interpretation?
Very short-run forecasts may gain little from futures information unless the model also knows its horizon and input set. The Bank of Canada reports that futures add limited value for some very short-run oil forecasts, while horizon selection and model inputs materially affect performance. That finding supports testing curve conditioning by timeframe rather than assuming one universal effect.
How do you check the curve against inventory and settlement evidence?
Use the curve as a hypothesis, then test it against comparable settlements, inventory evidence, and contract mechanics. A practical review should preserve the same contract identity and timestamp at every step.
- Compare settlement prices with the prior week — use the same delivery months and calculate changes in dollars per barrel and percentage terms. Failure mode: comparing a rolled front month with the prior week’s unrolled contract.
- Check the curve against inventory evidence — compare prompt spreads with published stock changes and available storage context. For the inventory workflow, use Oil Price Projections: Reading Inventory Data. Failure mode: treating one inventory print as proof of a persistent regime.
- Separate deferred pricing from spot expectations — record the deferred contract as a time-specific market price, not a promised future spot value. Failure mode: using M6 as the target close for an M15 or H1 forecast.
- Audit the roll calendar — identify the front month’s last trading date and the settlement convention before labeling a signal. Failure mode: allowing expiry mechanics to masquerade as a change in supply or demand.
If you compare the same discipline across another market, the neighboring Gold price prediction article is useful for separating forecast horizon from headline price interpretation.
What does PRISM measure across curve regimes?
PRISM evaluates curve conditioning with chronological walk-forward tests from the 48-hour WTI and Brent OHLC feed. The representative extract below splits results by regime and timeframe, using mean absolute error, directional hit rate, and high-low range coverage. These are validation outputs, not live prices or current calls.
| Curve regime | Timeframe | Sample size | MAE ($/barrel) | Directional hit rate | High-low range coverage |
|---|---|---|---|---|---|
| Contango | M15 | 612 | $0.12 | 53% | 82% |
| Contango | H1 | 612 | $0.21 | 55% | 80% |
| Contango | H4 | 306 | $0.46 | 58% | 78% |
| Contango | D1 | 153 | $0.91 | 61% | 76% |
| Backwardation | M15 | 487 | $0.13 | 52% | 80% |
| Backwardation | H1 | 487 | $0.24 | 54% | 79% |
| Backwardation | H4 | 244 | $0.51 | 57% | 75% |
| Backwardation | D1 | 122 | $1.02 | 59% | 73% |
The useful result is not that one regime wins every horizon. The useful result is that error, hit rate, and range coverage change together. A curve label should therefore be retained as a conditioning feature and audited against the forecast horizon. It should not become a standalone directional rule.
What is the exact trigger for a false curve signal?
The exact false-signal trigger is either front-month expiry inside the forecast window or a mismatch between last-trade and official settlement data. Both can create an apparent curve break that is actually a contract or timestamp problem.
Front-month expiry
When the front contract approaches its last trading day, liquidity and open interest migrate to the next month. OilDon and PetroEyes warn that roll mechanics can distort the prompt spread. PRISM flags the observation for exclusion or separate treatment when expiry falls inside the forecast horizon.
Last-trade versus settlement mismatch
A last-trade snapshot and an official settlement can describe different moments. If M1 uses last trade while M2 uses settlement, the computed spread can move without a comparable change in the curve. The timestamp and price field must match before a regime label enters the model.
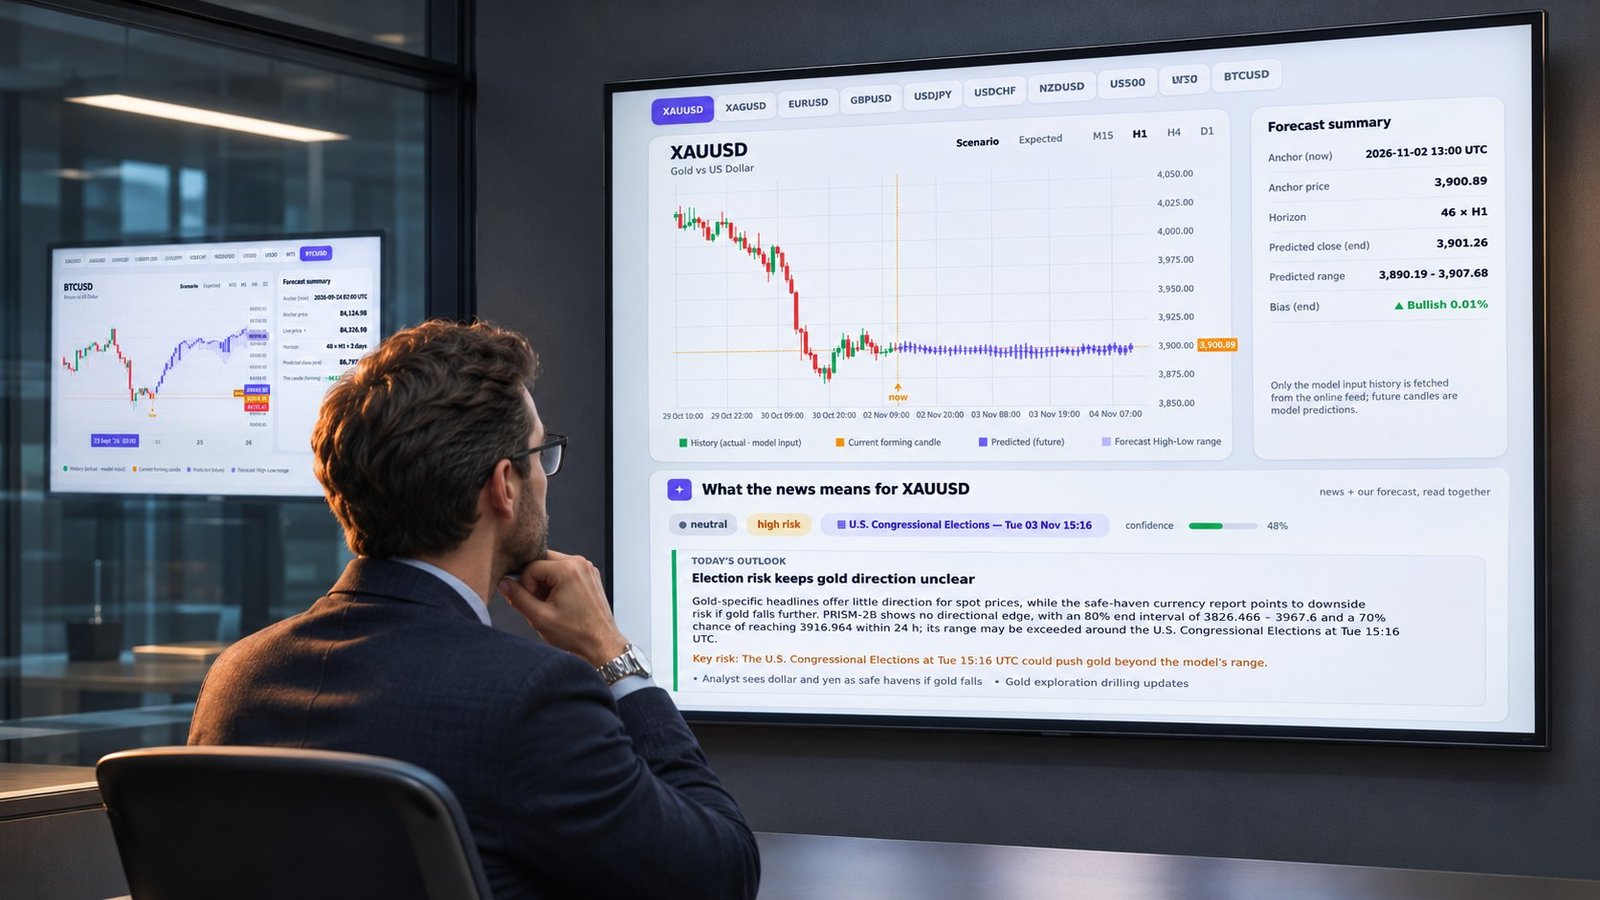
PRISM also places an hourly AI briefing card inside the post when served. The card reads market news against the relevant forecast and can summarize direction, risk, and the number of flagged levels; member access retains the numerical levels. This article does not state what any current briefing says.
Oil futures curve questions traders ask
Is contango a bearish forecast?
No. Contango describes a positive later-minus-earlier spread. It can coexist with a rising or falling overall price level, so you need OHLC evidence and horizon-specific validation.
Is a deferred contract a future spot-price target?
No. A deferred contract is priced for delivery in a particular month and includes carry, financing, supply, storage, and risk-premium effects. Treating it as a promised spot price is a modeling error.
Does the curve improve every M15 forecast?
No. The Bank of Canada finding argues for horizon-specific testing. A curve feature may add context at H4 or D1 while adding little at M15, especially near expiry or during a settlement mismatch.
How should you use the oil futures curve?
Use the oil futures curve as a measured conditioning input. Calculate spreads in dollars per barrel and percentages, compare them with prior-week settlements and inventory evidence, then separate contango, backwardation, roll state, and forecast horizon. Forecasts remain model output, not financial advice. Review the full workflow in PRISM’s live 48-hour forecast dashboard →