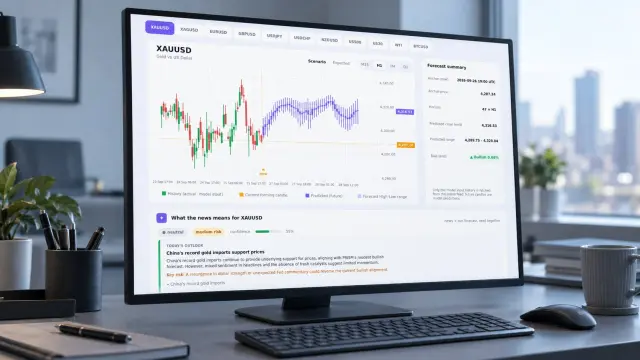
Does forex prediction indicator repaint? Only if a signal tied to a closed candle changes value or flips direction after you've already acted on it. That's the specific failure mode MT5 traders worry about before trusting any AI forecast tool — and it's a reasonable worry. Repainting is the mechanism behind some of the most misleading indicator marketing in retail forex.
PRISM Forecasting publishes a new 48-hour OHLC forecast every 15 minutes, timestamped to a fixed anchor. From a distance, that update cadence can look like repainting. It isn't. This guide draws the line precisely, with a four-point test you can run against PRISM or any other indicator on your own chart.
Does Forex Prediction Indicator Repaint? The Technical Definition
EarnForex's guide on repainting indicators separates two behaviors traders lump into one word. Only one of them is a problem. That's repainting forex indicator explained in its simplest form: a normal recalculation of the live candle, and a rewrite of a candle that already closed.
The first is harmless. An RSI applied to Close price shifts on the forming candle as new ticks arrive — expected, not repainting in the sense traders fear. EarnForex notes you can remove this entirely by applying the indicator to Open price instead, since a candle's open never changes once the bar starts.
The second is the one that matters. EarnForex cites the Semafor indicator as a textbook case — a signal fires, looks clean weeks later, but was recalculated using price data from bars that hadn't formed yet when it first appeared. A buy arrow that slides two candles to the right, or disappears outright, isn't a display quirk. It's the indicator grading its own past using data it didn't have at the time.
Why Repainting Makes Backtests Lie
ea-coder.com's breakdown of repainting indicators makes the practical cost explicit: a repainting indicator fires an entry signal, price moves the wrong way, and the signal quietly disappears from the chart before you review the history. What's left behind looks like a string of clean trades. None of the false signals survive into the backtest.
That's why the repainting versus non-repaint MT5 indicator distinction matters more than most traders assume — it's not a technical footnote, it's the difference between a backtest you can trust and one edited after the fact. A strategy built on repainted history can show a hit rate well above what it produces live, because every losing signal that got rewritten never counted against it.
See also: Forex Volatility Position Sizing for a Widening Market
Re-Anchoring Is Not Repainting: How PRISM Publishes Forecasts
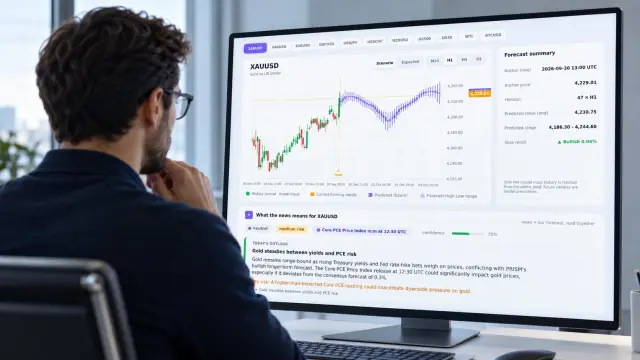
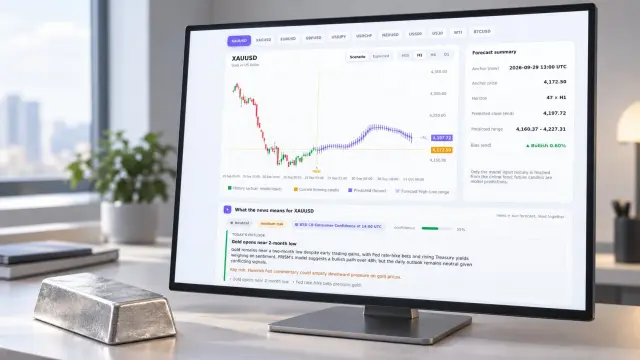
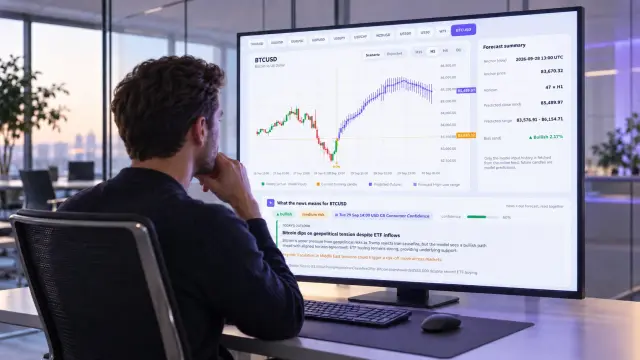
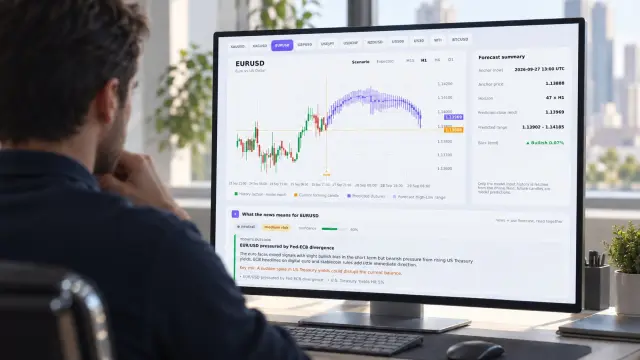
PRISM generates a 48-hour OHLC forecast for a fixed anchor timestamp — say, 14:00 UTC on a given day. Every 15 minutes PRISM re-anchors: it computes and publishes a new forecast object for a new anchor time. It does not go back and rewrite the OHLC values already issued for 14:00 UTC.
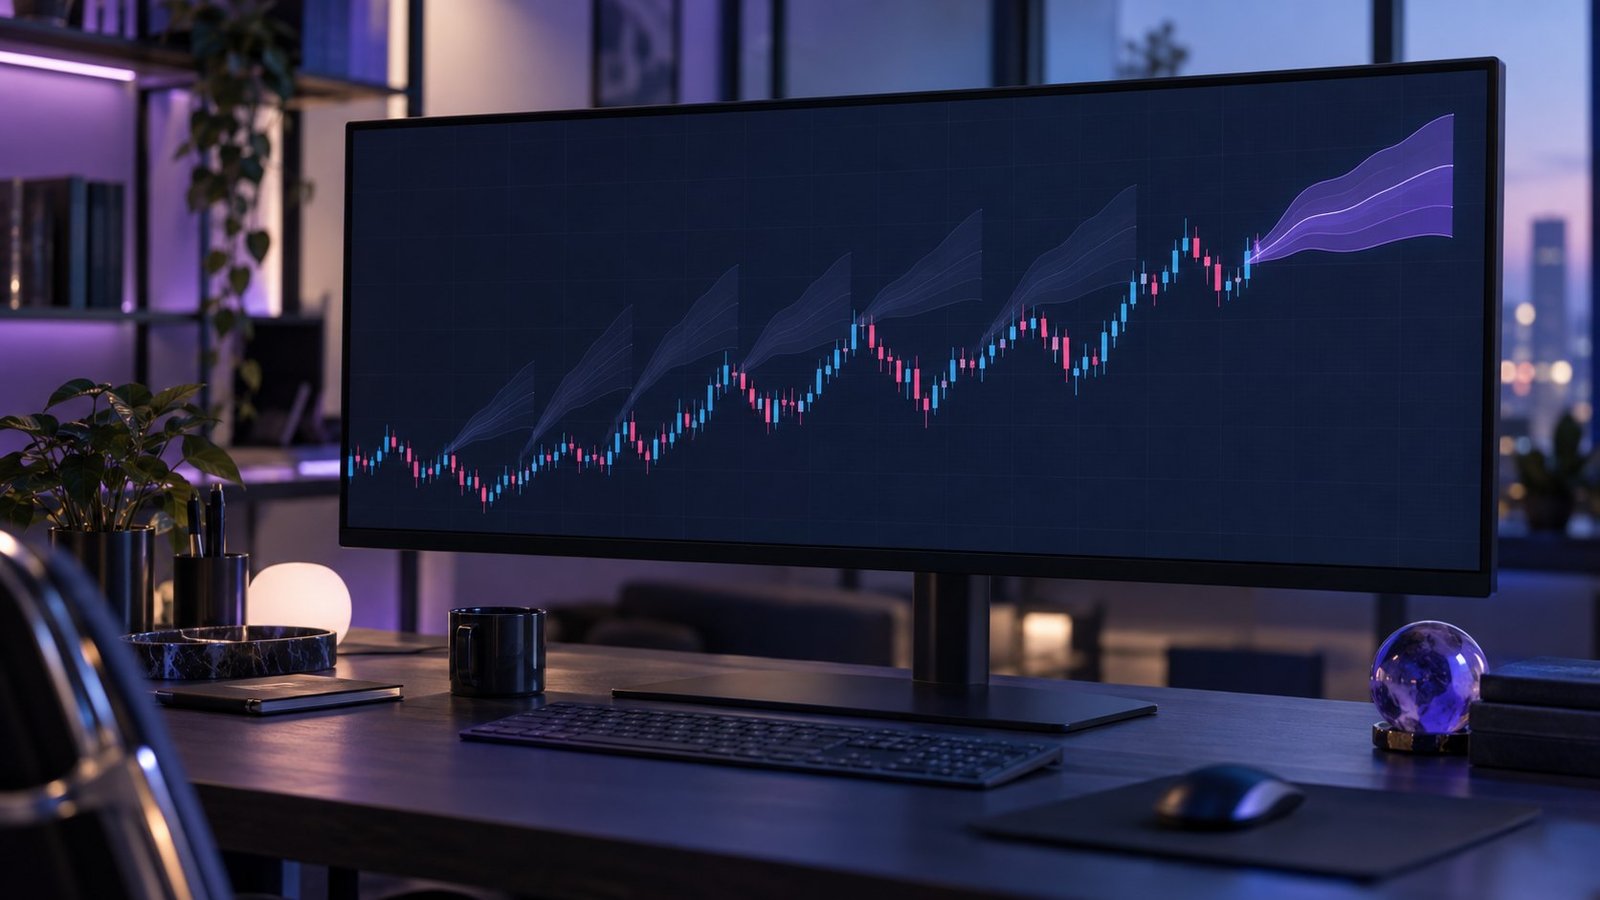
That's the structural difference. Repainting changes a value already shown to you for a period that's already closed. Re-anchoring adds a new, separate forecast next to the old one — the old one stays exactly as issued. PRISM timestamps and retains every anchored forecast across its 11 markets and 4 timeframes, so you can pull the 09:00 UTC anchor from three days ago on the Live Forecast page and compare it, value for value, against what actually printed.
This is also where AI forecast indicator reliability gets measurable instead of anecdotal. Because past anchors are frozen, you can compute a real hit rate — how often the forecasted H4 high was touched, how far the forecasted low missed — instead of trusting a vendor's claim. The methodology behind those anchors is laid out on The Model page.
See also: MT5 AI Forex Prediction: What Build 6180 Adds
A 4-Point Test You Can Run on Any Forecasting Indicator
You don't need to take a vendor's word for it. Run this on PRISM, or on any MT5 indicator you're evaluating, before you size a single trade off its signal.
- Screenshot the signal or forecast the moment it appears, including its timestamp and OHLC values.
- Wait for the relevant candle — M15, H1, H4, whatever timeframe you're checking — to close.
- Pull the same historical timestamp from the vendor's own archived record, not just the live chart.
- Compare the two: if the values, direction, or entry price changed, that's repainting. If a new, separate forecast appeared for a new anchor and the old one is untouched, that's re-anchoring.
FAQ
Does re-anchoring every 15 minutes count as repainting?
No. Re-anchoring publishes a new forecast for a new timestamp. Repainting alters a value already published for a timestamp that's already passed. PRISM never modifies a past anchor's OHLC values.
Can I verify a non-repaint MT5 indicator myself?
Yes — MT5's Strategy Tester in visual mode lets you replay an indicator tick by tick and watch whether signals on closed bars change. Run it on M1 for the fastest read.
Does a repainting indicator always mean fraud?
Not always. ZigZag and Fractals repaint on purpose and stay useful once you know it. The problem is repainting a developer doesn't disclose, or a signal used for live entries that later vanishes from the chart.
Check Before You Trust a Signal
Run the four-point test above on any indicator before you size a trade against its signal — including ours. PRISM's MT5 Indicator publishes anchored, timestamped forecasts you can audit anchor by anchor, not a live line that rewrites its own history. Forecasts are model output, not financial advice, and every anchor stands on its own record. →