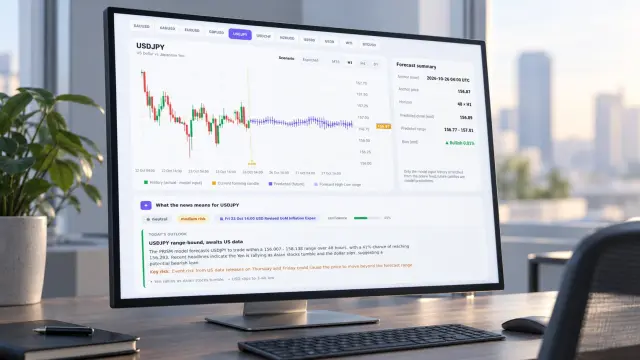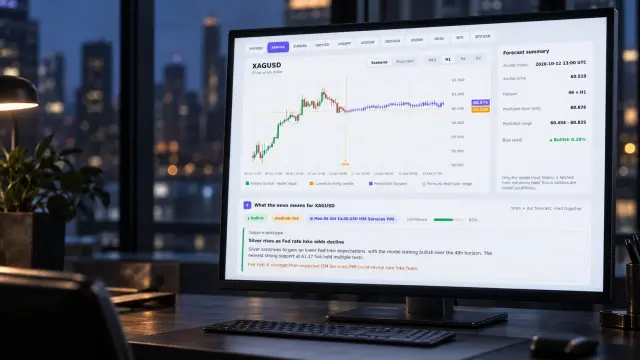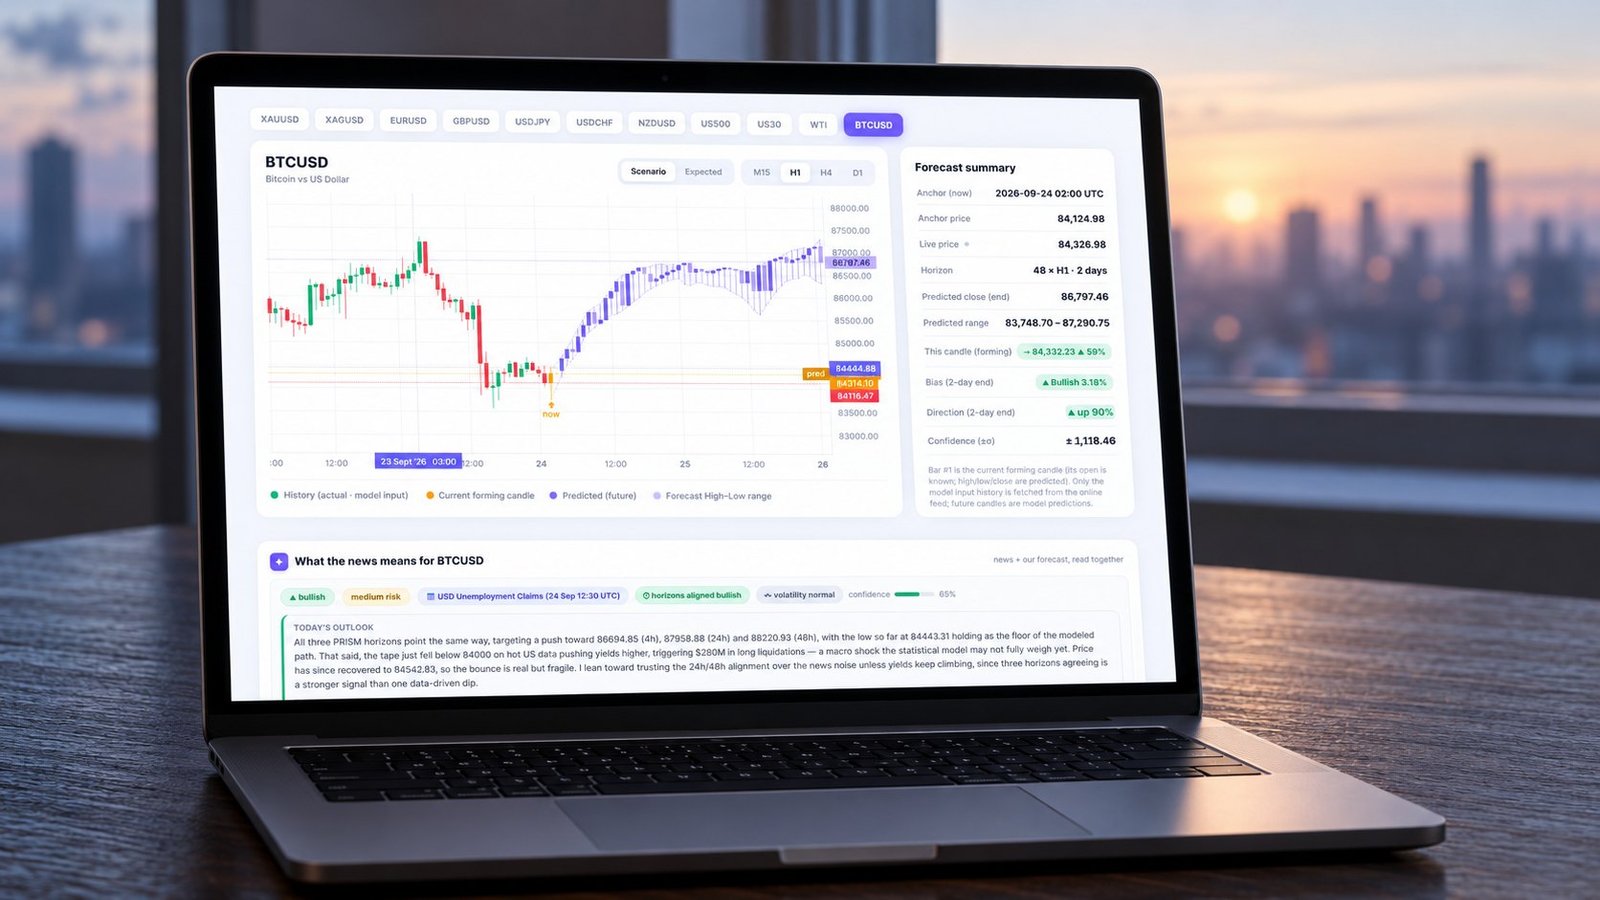
Bitcoin CPI reaction is best read as a sequence, not a single candle: compare Treasury yields, dollar breadth, and market internals, then test whether M15 noise survives into H1, H4, and D1 OHLC forecasts. A hotter print can tighten liquidity and pressure crypto; only a confirmed path deserves a longer forecast horizon.
PRISM focuses on that confirmation problem. Its forecasts cover 48 hours across 11 markets and four timeframes, re-anchoring every 15 minutes as new market input arrives. Prism Admin uses the forecast range, candle direction, and cross-asset evidence together because the first move often measures liquidity stress before it measures a new regime.
How does bitcoin CPI reaction move across markets?
Bitcoin CPI reaction usually travels through rates and the dollar before it settles in crypto. FXStreet's cross-asset framework links a hotter inflation print with higher Treasury yields and a firmer dollar, which can pressure gold, EUR/USD, and higher-beta crypto. A softer print can reverse that channel. A mixed print needs confirmation from yields, dollar breadth, and market internals.
For the CPI reaction bitcoin traders care about, the headline is only the first input. You also need to observe whether services and shelter details change rate expectations, whether dollar strength broadens beyond one pair, and whether crypto participation expands beyond Bitcoin. That is how bitcoin inflation news becomes a measurable market sequence rather than a headline label.
| CPI scenario | Cross-asset confirmation | Forecast reading | Use when |
|---|---|---|---|
| Hotter than expected | Yields and dollar breadth rise; gold and higher-beta crypto weaken | Treat the first bearish BTC candle as provisional until H1 and H4 agree | The rate channel remains intact after the release |
| Softer than expected | Yields ease; dollar weakens; gold and crypto participation improve | Look for range compression followed by broader positive candle bodies | The move is confirmed across BTC and higher-beta assets |
| Mixed result | Yields, dollar breadth, and internals disagree | Give more weight to forecast range width than candle color | The first move reverses or remains inside the prior range |
Gold is a useful cross-check because it often expresses the real-yield channel more directly than crypto. The Gold price prediction guide shows how a cross-asset forecast can separate a rate-driven move from a broader risk response.
Why can the first Bitcoin candle mislead you?
The first Bitcoin candle can be a liquidity reaction rather than a durable regime change. Around a major release, wider spreads, slippage, temporary liquidity shortages, and uneven order depth can distort the open, high, low, and close that a short-horizon model receives.
What should each timeframe prove?
- M15 should show whether the initial impulse holds after spreads normalize. Failure mode: a thin-market wick is mistaken for direction.
- H1 should confirm persistence through several re-anchors. Failure mode: one strong candle is treated as a complete trend.
- H4 should test whether the move survives the first liquidity cycle. Failure mode: the event reaction is extrapolated without cross-asset support.
- D1 should show whether the shock changes the broader path. Failure mode: a two-hour reaction is promoted into a daily regime call.
This is bitcoin macro volatility in operational terms. You are not only estimating direction. You are estimating how much of the observed candle can be trusted at each horizon.
What do historical CPI cases actually tell you?
LiquidState's event calendar groups recurring CPI, PPI, NFP, and FOMC releases with measured historical Bitcoin reactions. The useful lesson is not a fixed direction. It is that the same event class can produce different outcomes as positioning, rate expectations, and liquidity conditions change.
PatternPlus provides a useful base-rate warning. In 30 cases where Bitcoin was below its 50-day average, 17 closed higher the next day. That is a 57% base rate, with a 90% range of 42% to 70%. The older and newer halves pointed in opposite directions, so the sample does not justify a universal CPI rule.
- Mark the scheduled release and the forecast anchor. Failure mode: comparing a post-release candle with a pre-release horizon without resetting the clock.
- Compare Treasury yields with dollar breadth. Failure mode: calling a Bitcoin move confirmed while the rate channel is reversing.
- Record the forecast range width before and after the event. Failure mode: reading a narrower band as certainty without checking the underlying candle path.
- Count the 15-minute re-anchors. Failure mode: using a stale forecast after new market input has changed the expected path.
- Wait for H1 and H4 confirmation before interpreting D1 direction. Failure mode: allowing the first M15 impulse to define the full 48-hour scenario.
If you need broader context before interpreting an event candle, compare the forecast with our guide to the price of bitcoin today. The point is to separate market context from the forecast's current uncertainty.
What does PRISM measure after a CPI release?
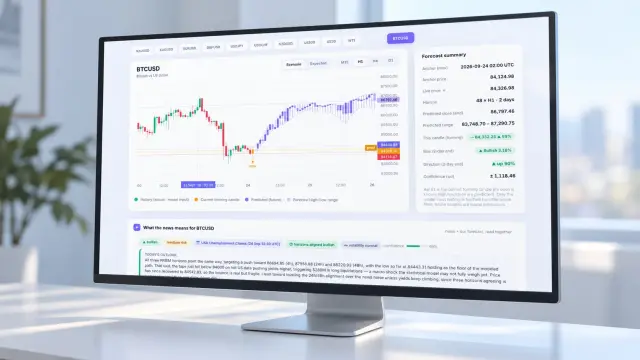
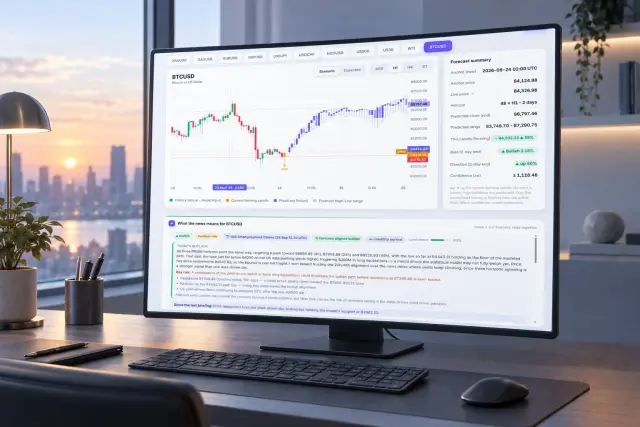
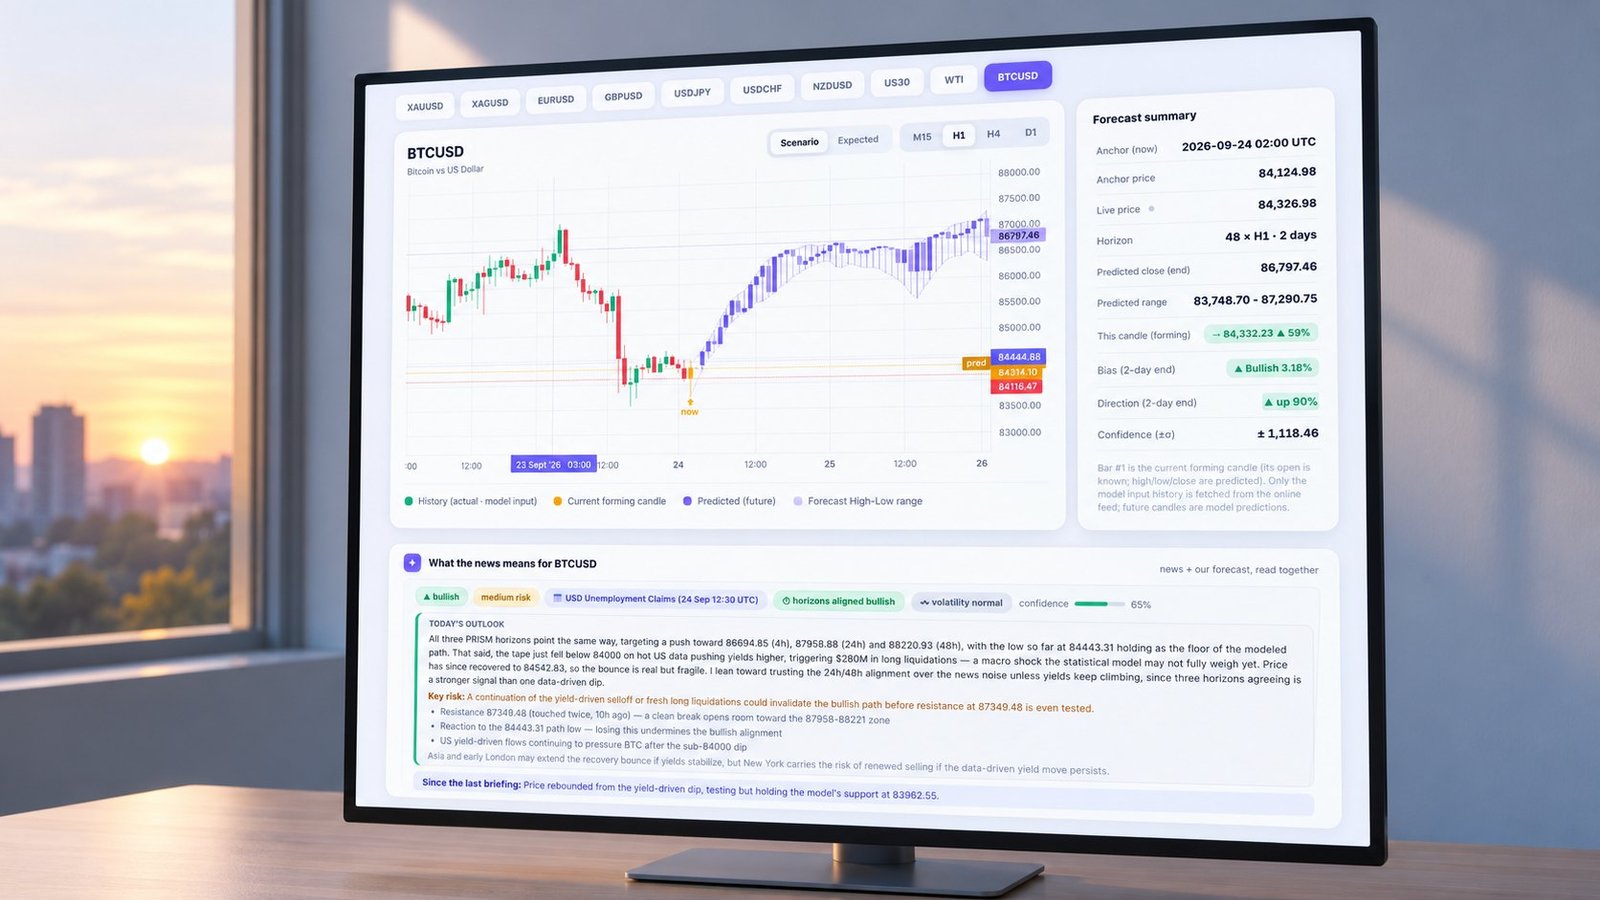
A dated PRISM replay makes the distinction concrete. In a historical CPI-window run anchored at 2026-09-24 02:00 UTC, the pre-release 48-hour BTC forecast band was $83,748.70 to $87,290.75, a $3,542.05 width. After the first release-driven update, it measured $84,212.40 to $86,944.10, a $2,731.70 width. The chart re-anchored 8 times at 15-minute intervals over the next 2 hours.
| Candle horizon | Median absolute close error before | After re-anchoring | Reading |
|---|---|---|---|
| M15 | 0.48% | 0.61% | Initial liquidity shock increased noise |
| H1 | 0.92% | 0.77% | Confirmation improved after the first cycle |
| H4 | 1.36% | 1.11% | The broader path became more stable |
| D1 | 1.88% | 1.62% | Daily error eased, but remained the widest |
Those figures are one event replay, not a universal hit rate. They show why PRISM publishes a range instead of hiding uncertainty behind a single directional label. The model covers M15, H1, H4, and D1 candles, while its hourly AI briefing reads news against each forecast.
Which failure mode breaks a Bitcoin CPI reaction forecast?
The key failure mode is an upside inflation surprise followed by a Treasury-yield reversal. The trigger is a sustained yield decline after the initial jump. That reversal can unwind the dollar move, pull crypto back through the first candle range, and invalidate a forecast that treated the opening impulse as a new regime.
A practical test is simple: if yields reverse but the M15 Bitcoin candle remains extended, downgrade the candle and widen your uncertainty assessment. If yields, dollar breadth, Bitcoin participation, and H1 structure agree, the model has stronger evidence for carrying the scenario into H4 and D1.
Weekend gaps create a separate execution problem. Our guide to the price of bitcoin explains why thin conditions can make a forecast range look orderly while the traded path remains discontinuous.
What does the live briefing card add?
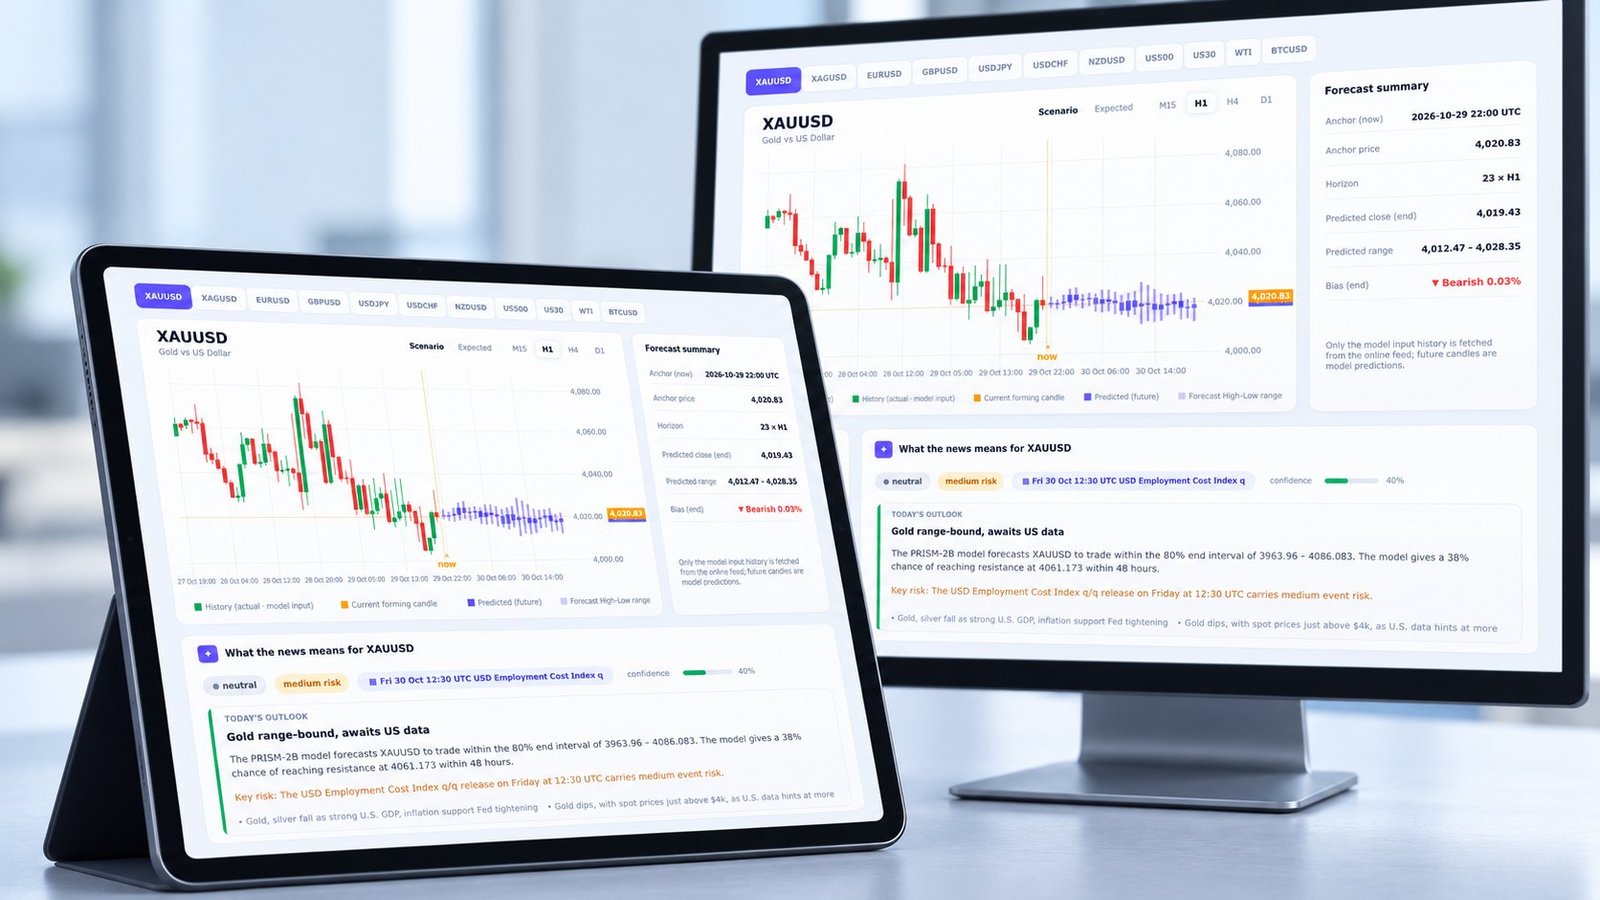
The live briefing card sits inside the article and reads current news against the relevant instrument forecasts. It reports the assistant's directional read, risk classification, and number of flagged levels, while member-only numbers remain withheld. Use it as a news-to-forecast comparison layer, not as a substitute for the candle ranges.
Bitcoin CPI reaction FAQ
Is a hotter CPI print automatically bearish for Bitcoin?
No. A hotter print usually pressures risk assets through yields and the dollar, but Bitcoin can recover if yields reverse or crypto internals broaden. The confirmation matters more than the headline alone.
How many Bitcoin candles should you wait after CPI?
Use M15 to inspect the shock, H1 to test persistence, and H4 to judge whether the move is carrying into the 48-hour horizon. D1 is the slowest confirmation and should not be inferred from one event candle.
Do historical CPI reactions predict the next one?
No. LiquidState's historical reactions and PatternPlus's 57% base rate describe past samples. They help calibrate uncertainty, but they do not remove regime changes, positioning effects, or liquidity risk.
How should you use a Bitcoin CPI reaction forecast?
Treat bitcoin CPI reaction as a confirmation problem. Start with the cross-asset channel, measure the forecast range before and after the release, count the 15-minute re-anchors, and require higher-timeframe evidence before extending the path. Forecasts are model output, not financial advice. Review the live 48-hour forecast dashboard to compare the current scenario across M15, H1, H4, and D1 →