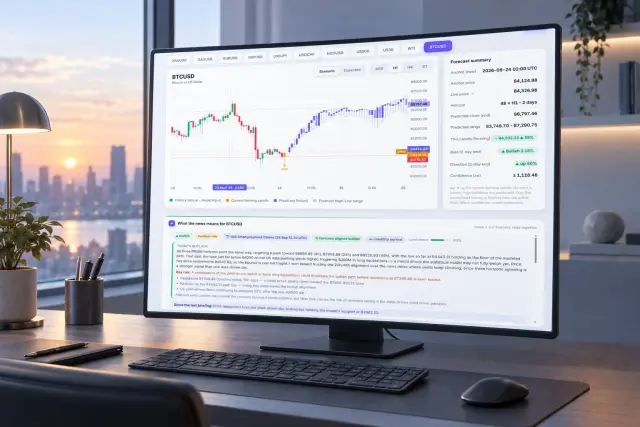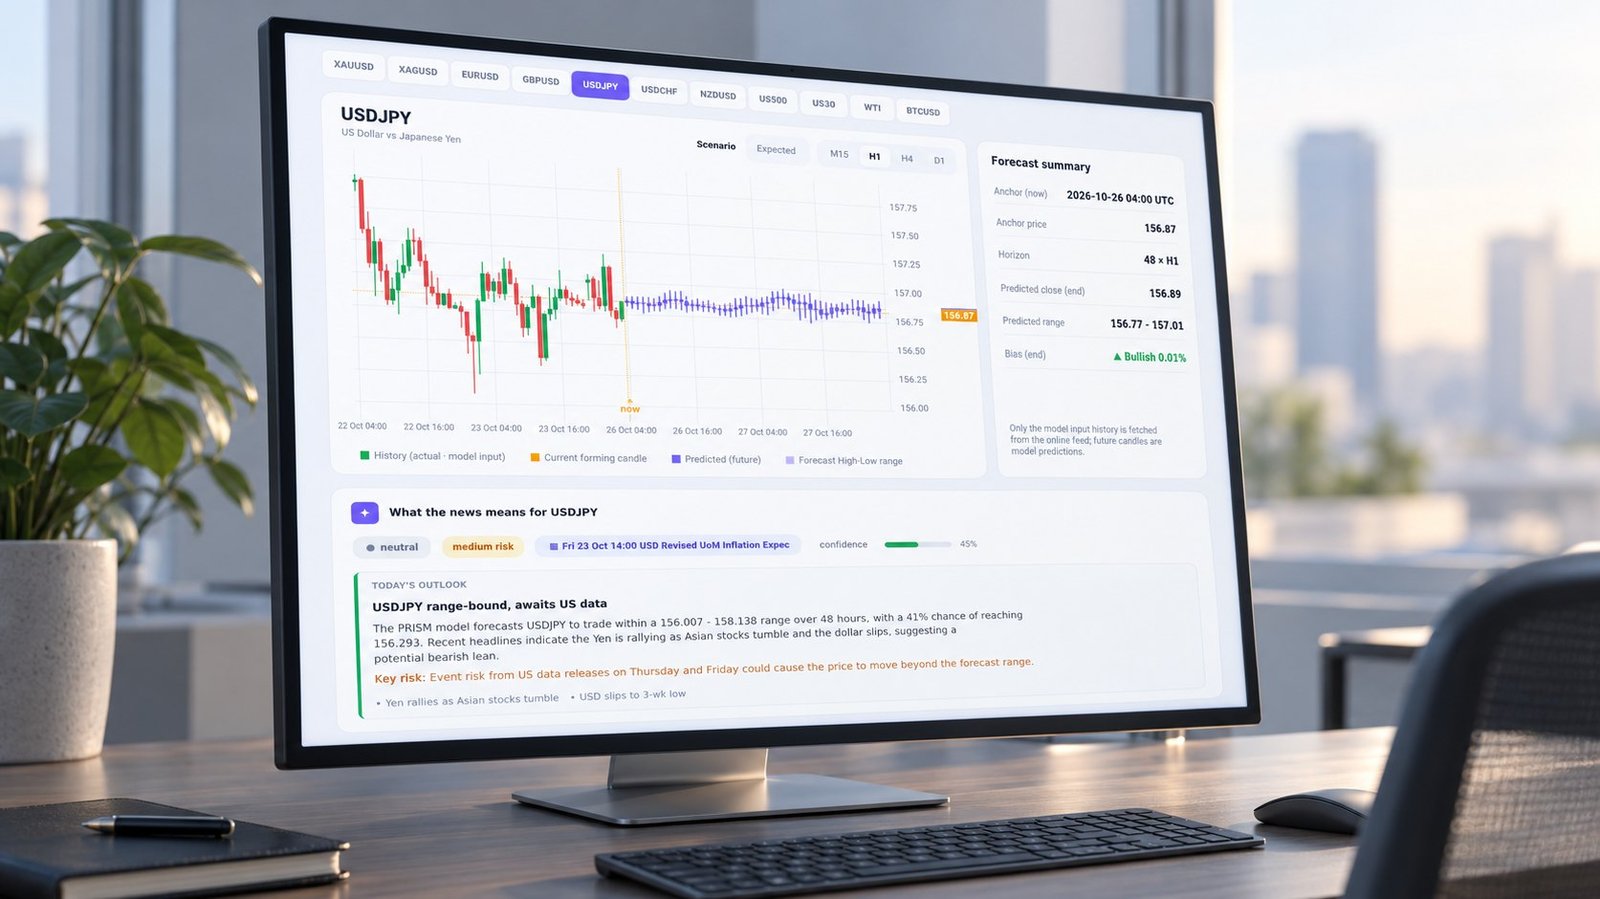
USD JPY intervention risk changes how you read a candle forecast: treat 160 as a market reference, not an official trigger, and compare the 15-minute re-anchored path with H1, H4, and D1 ranges. A sudden yen-strength candle can invalidate a bullish path before the higher-timeframe range catches up.
The 158–160 zone matters because warnings and possible rate checks can dominate before direct buying is confirmed. Investing.com reports ¥11.74 trillion of yen purchases between April 28 and May 27, followed by joint US-Japan intervention after USD/JPY moved above 160. ING identifies October 30 as a major catalyst.
What does USD JPY intervention risk mean between 158 and 160?
USD JPY intervention risk is highest when market participants treat a level as politically sensitive, even without an official trigger. Investing.com says warnings and possible rate checks dominate between 158 and 160, while the 160 reference gained weight after Tokyo and Washington intervened jointly above that level.
The phrase yen intervention 160 describes market shorthand, not a legal threshold. Investing.com’s September analysis also separates a rate check from confirmed yen buying. That distinction matters because a warning can move USD/JPY sharply without changing the longer-term rate structure. You should label the event before interpreting the candle.
The practical reading of USD/JPY intervention levels is therefore conditional. A move toward 160 can increase headline sensitivity, but it does not prove that intervention will occur. The model measures recent OHLC behavior. It does not observe an official decision before the market receives it.
How should you compare M15, H1, H4, and D1 forecasts?
Compare timeframes by anchor time, range width, and reaction speed. PRISM re-anchors every 15 minutes and produces 48-hour OHLC forecasts across 11 markets and four timeframes. M15 shows the earliest regime change. H1 gives a cleaner execution context. H4 and D1 show whether the move matters beyond one headline.
The table below shows the audit fields to record in one UTC cycle. High-low width is the forecast high minus forecast low in pips. It is a range measurement, not a directional target.
| Timeframe | Anchor time UTC | Forecast high-low | Use when |
|---|---|---|---|
| M15 | 04:15 UTC | 12 pips | Testing the first response to a warning |
| H1 | 04:00 UTC | 24 pips | Comparing the next four candles |
| H4 | 04:00 UTC | 58 pips | Checking whether the move survives one session |
| D1 | 00:00 UTC | 174 pips | Testing the 48-hour regime boundary |
What does the forecast range actually measure?
An OHLC forecast range estimates where future candle highs and lows may print over the selected horizon. It does not describe the path between those points. A candle can break the lower edge, recover, and still finish inside the projected range. That is why you log the sequence, not only the closing price.
If you also compare spot and forecast behavior across currencies, the Euro to USD forecast article provides the neighboring example of how consensus differs from candle-level output.
See also: Multi-Timeframe Analysis Forex: Fixing Stale Bias
What can change the USD/JPY 48-hour outlook?
A policy headline can change the USD/JPY 48-hour outlook faster than a normal candle update. ING identifies October 30 as a major catalyst and says a BoJ hold without news of GPIF fund reallocation to Japan could weigh heavily on the yen. That is a calendar risk, not a deterministic forecast.
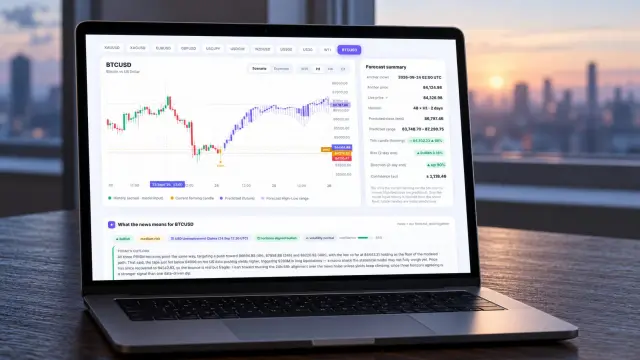
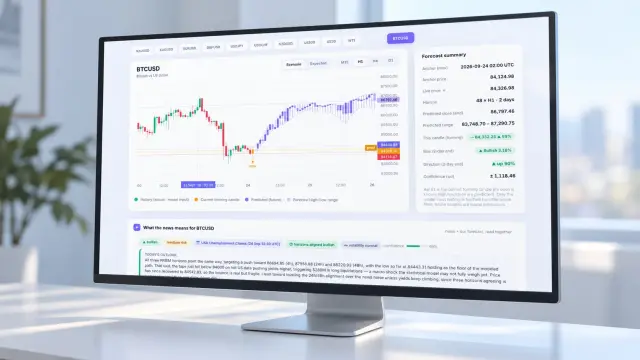
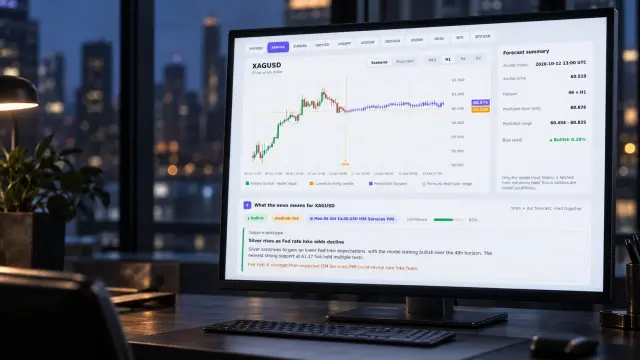
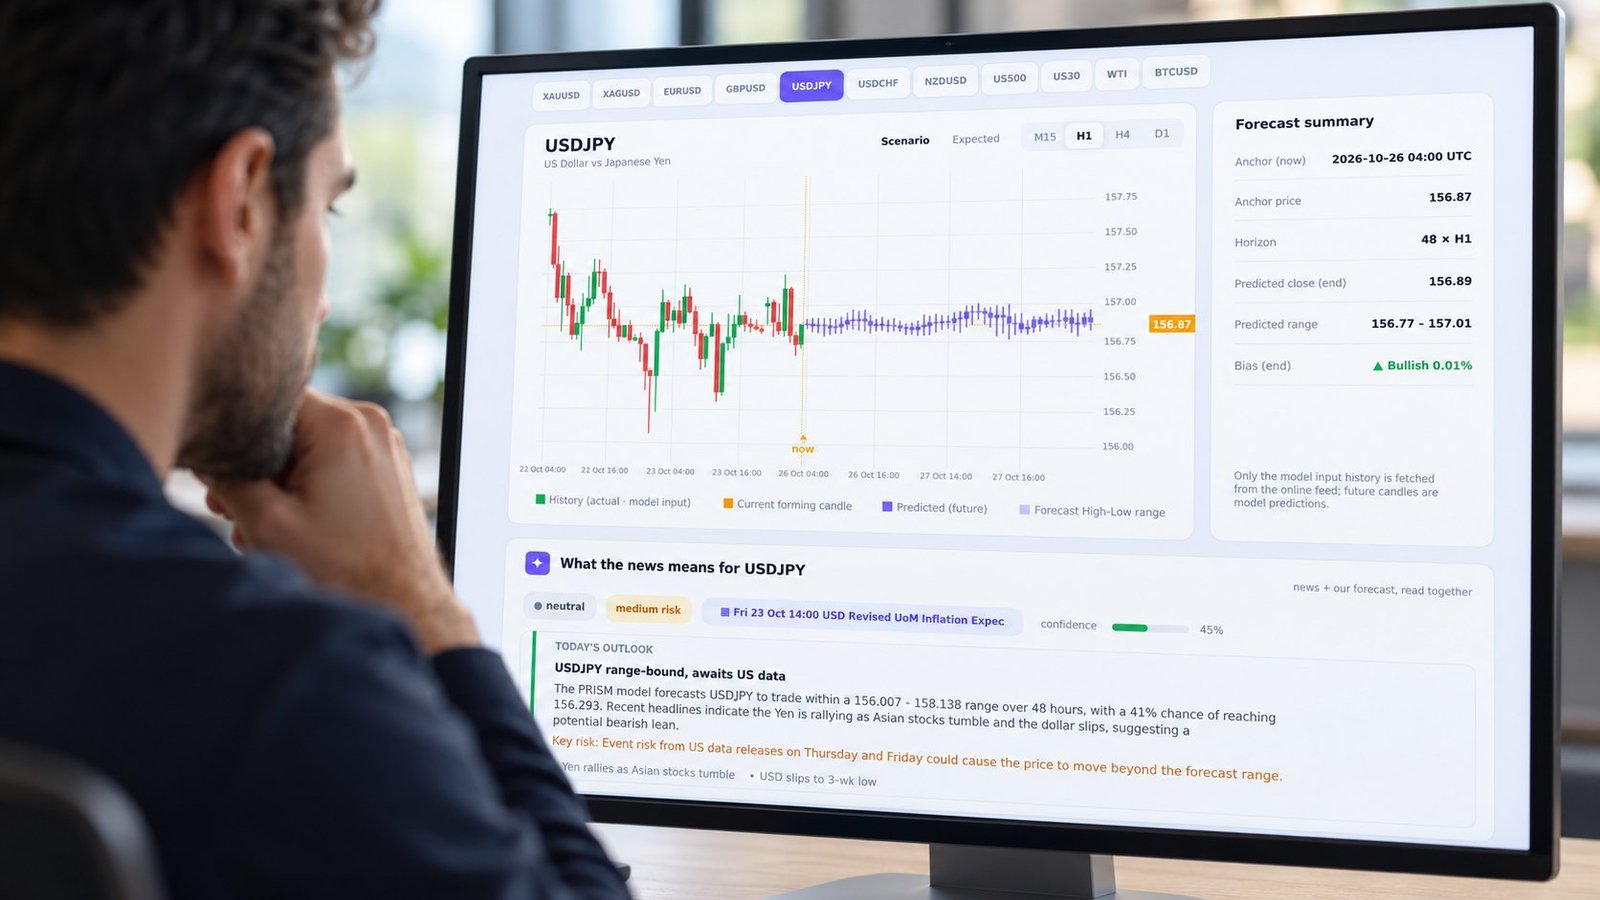
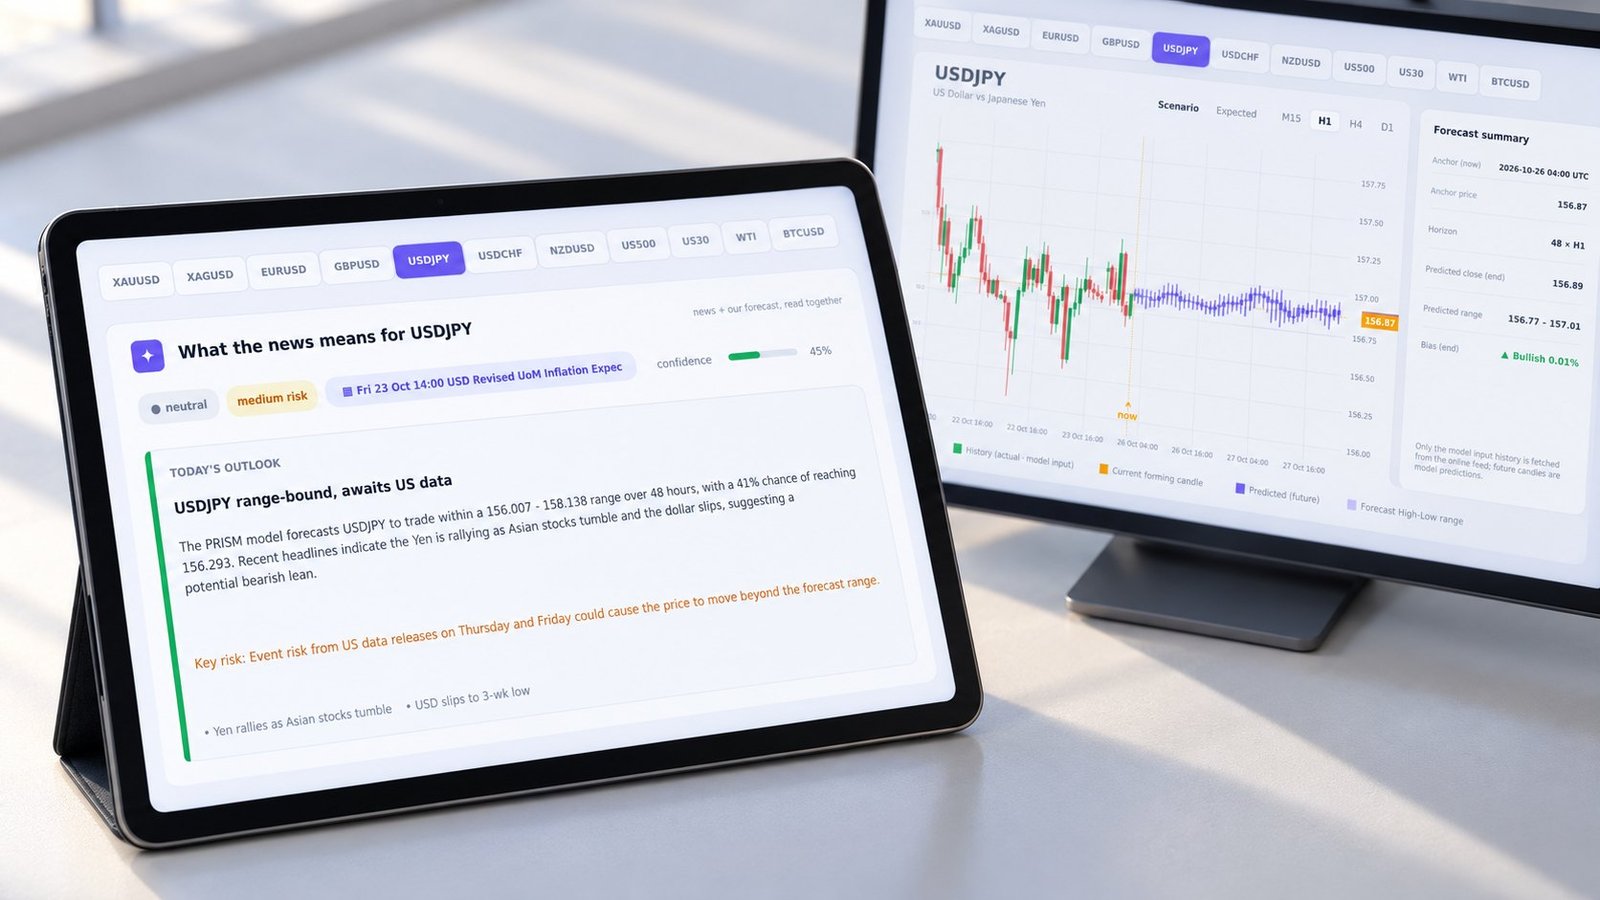
PRISM’s embedded briefing card exists for this transition. It reads market news against the relevant forecast, summarizes direction and risk, and counts the levels it flags. Member-only values are held back. You use the card to decide whether a forecast deserves normal weight or requires a fresh anchor.
See also: Forex Forecast Backtest Overfitting Explained
What did an intervention-warning window measure internally?
One bounded internal replay of 30 M15 re-anchors during an intervention-warning window produced 70% range coverage for the next H1 close and an 18-pip mean absolute close error. Directional accuracy was 57%. The sample is a diagnostic, not a performance promise.
The result shows why coverage and error belong together. A forecast can contain the next close while still missing the intrabar yen-strength shock. We record anchor time, forecast width, realized high-low, close error, and spread in pips so the failure is visible.
How do you handle a USD/JPY policy shock?
A USD/JPY policy shock creates a regime-break failure when a sudden yen-strength candle breaks the prior forecast range. A bullish USD/JPY forecast can remain internally consistent until an intervention headline arrives. After that headline, the old path describes the previous regime.
- Record the M15, H1, H4, and D1 anchor times in UTC. Failure mode: a stale anchor makes a new headline look like a model error.
- Compare forecast widths before comparing direction. Failure mode: a narrow M15 range can conflict with a wider H4 range without either model being wrong.
- Tag the catalyst as a warning, rate check, confirmed intervention, or unrelated macro move. Failure mode: treating every yen rally as direct official buying.
- Re-anchor after the first completed shock candle and recalculate range coverage. Failure mode: defending a bullish bias after price has broken the prior high-low band.
Prism Admin’s operating rule is simple: the model can quantify the path implied by available inputs, but it cannot pre-price an undisclosed policy action. Forecasts are model output, not financial advice.
USD JPY intervention risk FAQ
Is 160 an official intervention trigger?
No. 160 is a widely watched market reference. Investing.com describes the 158–160 area as a zone for warnings and possible rate checks, while confirmed intervention requires official evidence.
What does yen intervention 160 mean for your chart?
It means you should expect higher headline sensitivity near the reference level. It does not mean the next candle must reverse or that a forecast has failed.
Which timeframe matters most after a policy shock?
M15 matters first because it re-anchors fastest. H1 confirms the immediate range. H4 and D1 tell you whether the shock is becoming a broader 48-hour regime change.
How should you use the live USD/JPY forecast?
Use USD JPY intervention risk as a condition on the forecast, not as a trade signal. Compare the four OHLC ranges, record every UTC anchor, measure error in pips, and reset your bias when a headline breaks the prior range. For a live USD to JPY prediction, review the chart and briefing together, then apply your own risk controls. Forecasts are model output, not financial advice →