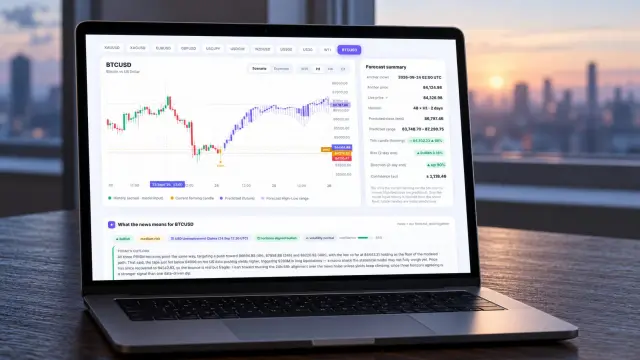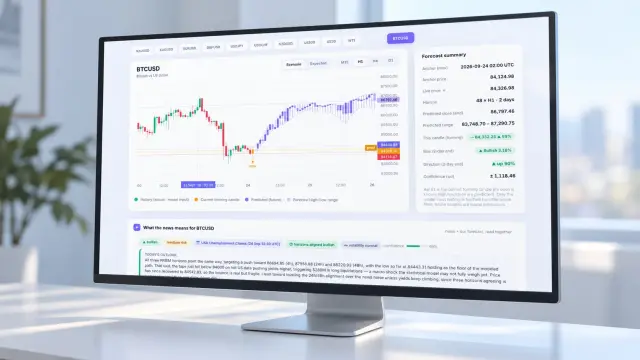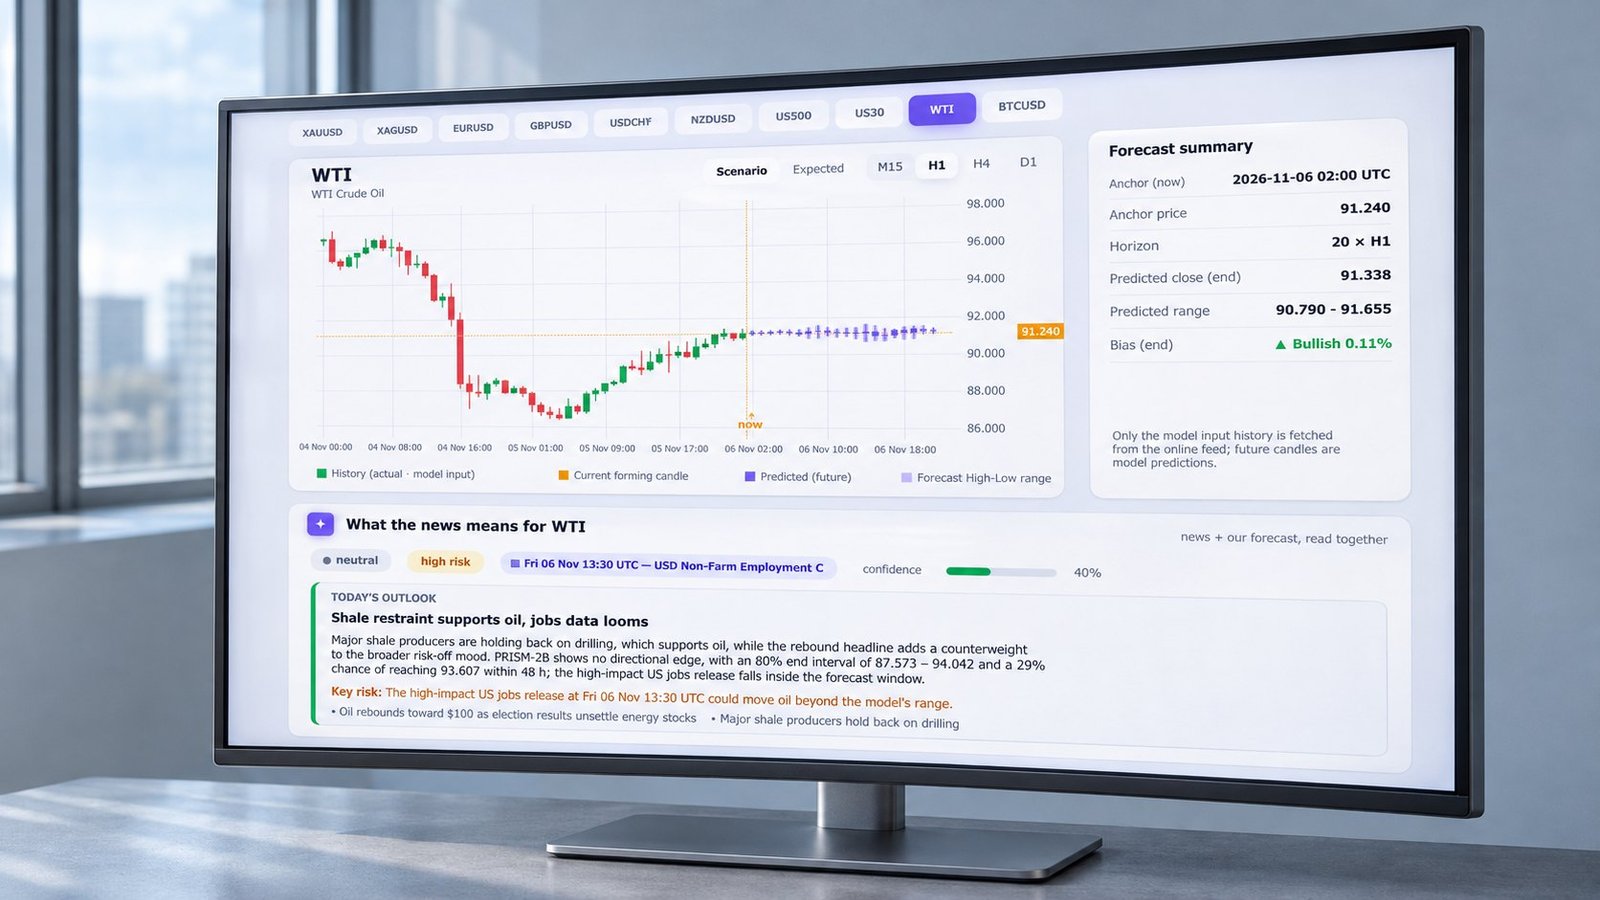
Oil price after jobs report is not a one-variable trade. Strong payrolls can lift fuel-demand expectations, yet higher rate expectations and a firmer dollar can pressure crude. The useful answer is horizon-specific: measure the next session, five sessions, and 20 sessions separately, then compare the surprise with PRISM’s OHLC ranges.
That is the gap this guide addresses. Historical returns show the base rate, but they do not show how a labor surprise travels through demand, rates, and the dollar into M15, H1, H4, and D1 candle forecasts.
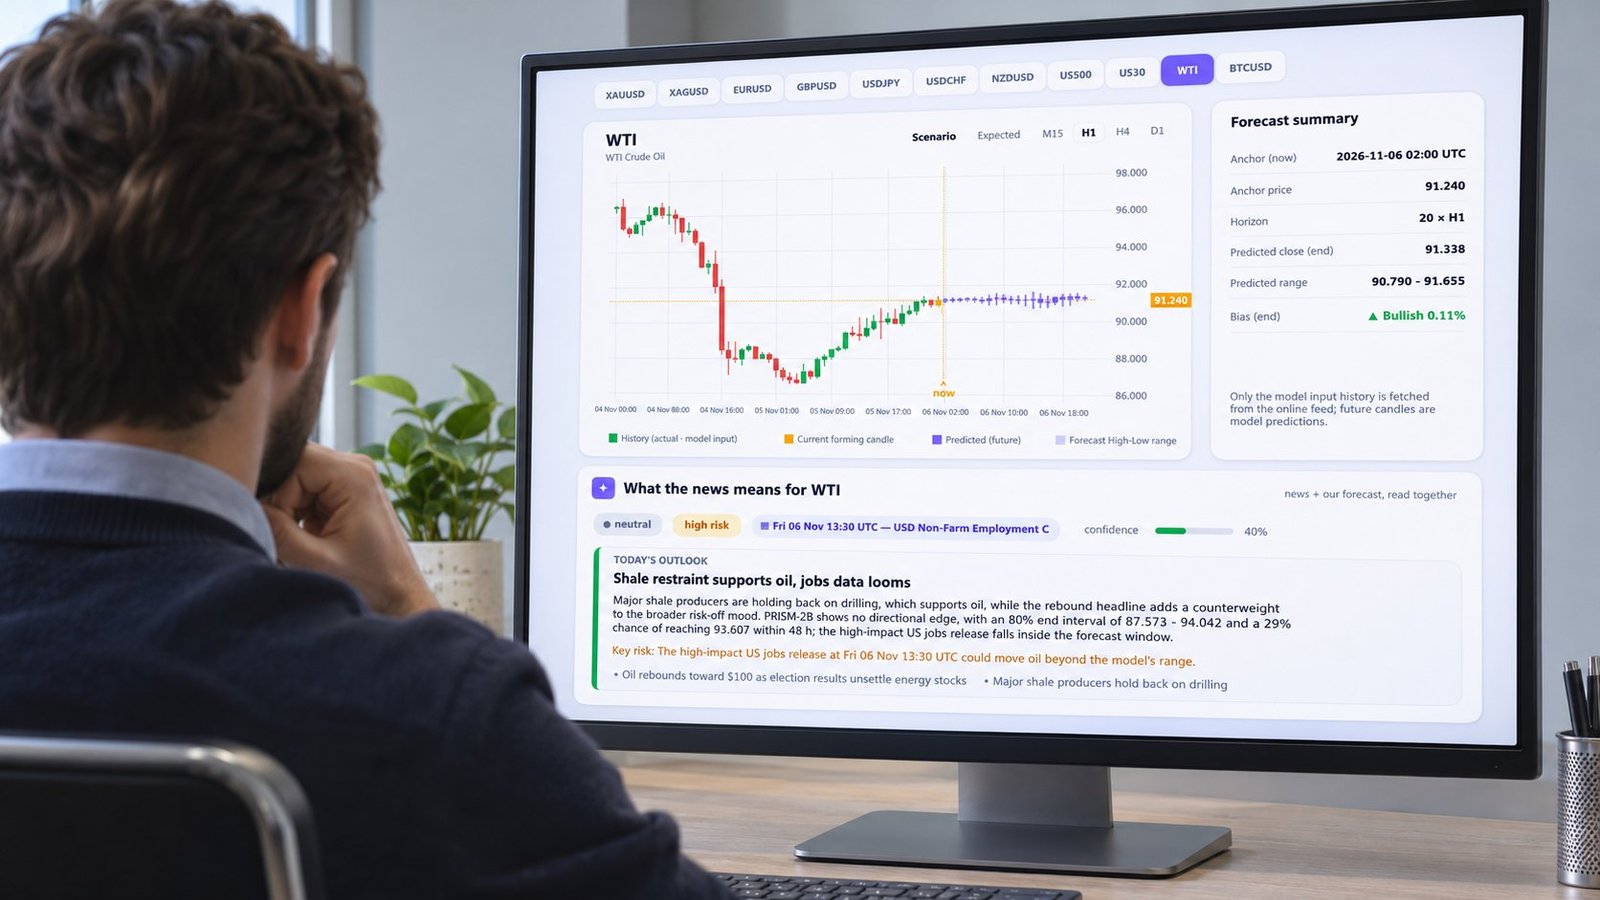
Why can oil rise or fall after a jobs report?
The jobs report oil reaction has two competing engines. Strong employment can imply better transport and industrial demand, while higher yields and a stronger dollar can reduce the dollar price of commodities and weaken risk appetite.
AP’s coverage connects JOLTS, weekly claims, and payrolls as parts of the labor-market signal. It also describes oil’s inflation channel. That creates a feedback loop: stronger crude can reinforce inflation concerns, which can keep rates higher and offset the initial demand impulse.
Kiplinger lists nonfarm payrolls at 8:30 a.m. ET and treats unemployment data as a key companion to the headline payroll number. Revisions matter because they can change whether the labor-market trend still supports the original macro interpretation.
- Demand channel — stronger employment can support gasoline, diesel, aviation, and freight expectations.
- Rates channel — a resilient labor market can reduce expectations for easier monetary policy.
- Dollar channel — higher U.S. yields can strengthen the dollar and weigh on dollar-denominated crude.
- Inflation channel — firmer oil can raise inflation concerns and alter the next policy reaction.
What does history say about oil price after jobs report?
Regimic’s 143-release sample shows a modest positive base rate, not a dependable directional signal. Crude was higher 52% of the time in the next session, with a median move of +0.19%. Over five sessions, it was higher 58% of the time, with a median move of +0.77%.
| Horizon | Higher observations | Median move | Use when |
|---|---|---|---|
| Next session | 52% | +0.19% | You are measuring the immediate WTI after nonfarm payrolls response. |
| 5 sessions | 58% | +0.77% | You are testing whether the first reaction persisted. |
| 20 sessions | 55% | +1.34% | You are separating the event from the broader monthly trend. |
| 20 sessions, risk-off backdrop | 43% | −1.01% | You are stress-testing a weak market regime. |
The risk-off result is the practical warning. A 43% up frequency and a −1.01% median 20-session move show how the surrounding regime can dominate the employment signal. Regimic’s sample is descriptive, so you should treat it as a base rate rather than a forecast.
How should you read a PRISM WTI forecast around payrolls?
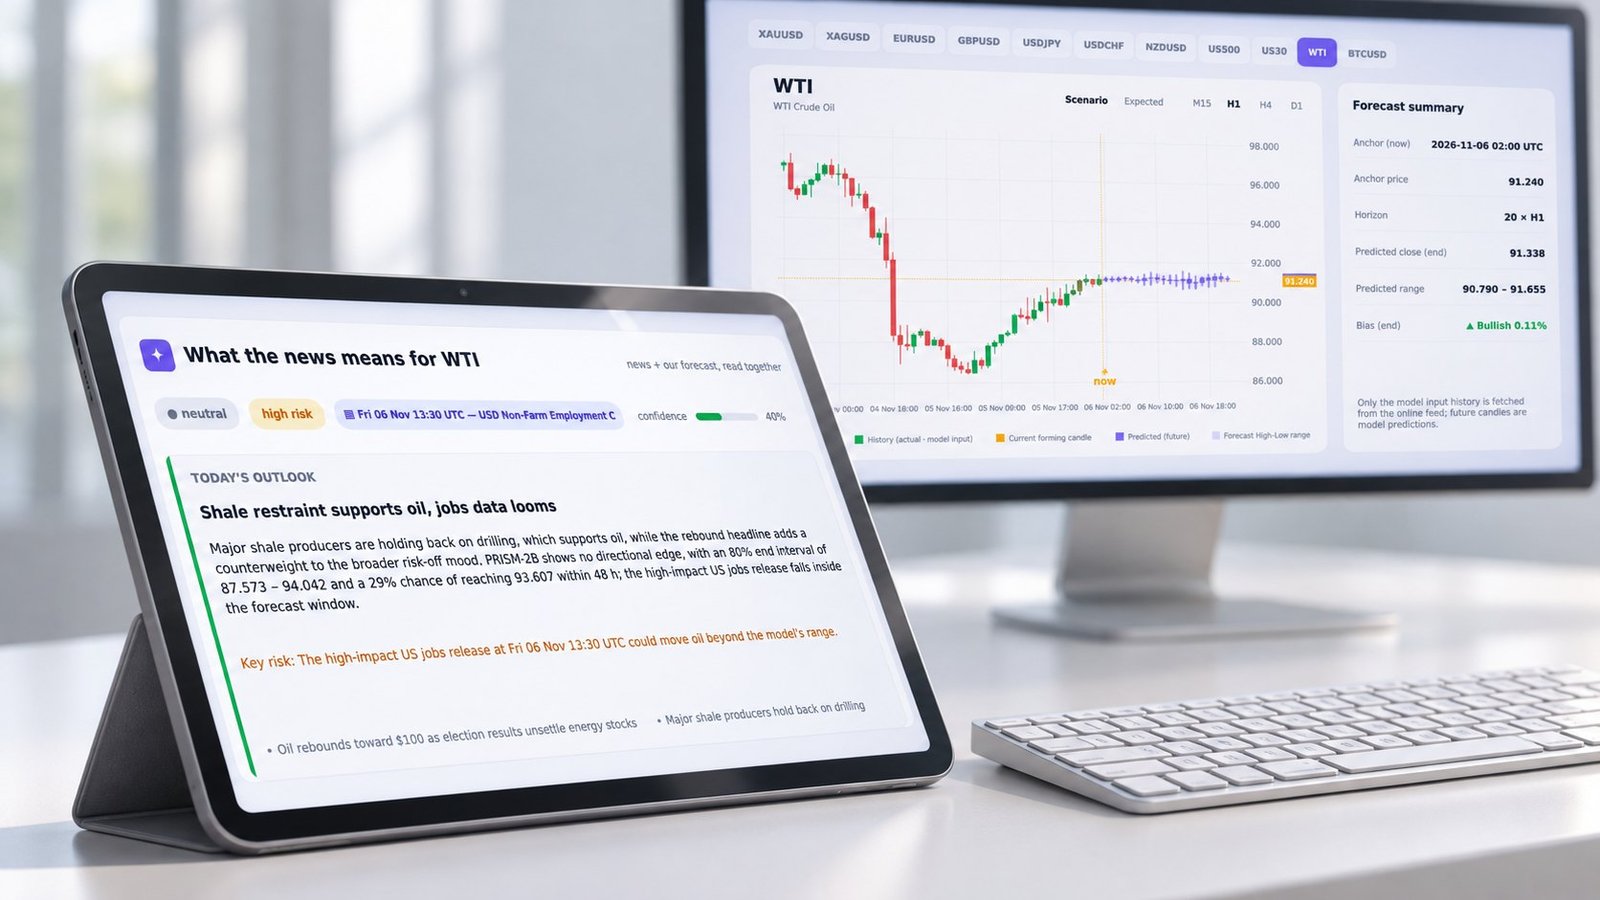
PRISM forecasts 48 hours of OHLC candles across M15, H1, H4, and D1. You should read the central OHLC scenario together with the expected close, the 80% close range, and the direction label. The label summarizes the model output; it is not a trade instruction.
The table below shows the anchor-relative record format PRISM uses for a non-live event study. Dollar figures are in $/bbl, and percentages are measured against the event anchor. A $0.50/bbl move equals 0.56% from a $90 anchor or 0.50% from a $100 anchor.
| View | Pre-release central OHLC | Post-release central OHLC | Expected close | 80% close range | Direction label |
|---|---|---|---|---|---|
| M15 | O +0.02, H +0.14, L −0.11, C +0.05 | O +0.06, H +0.21, L −0.07, C +0.13 | +$0.13 / +0.14% | −$0.16 to +$0.31 / −0.18% to +0.34% | Bullish |
| H1 | O +0.03, H +0.24, L −0.17, C +0.09 | O +0.11, H +0.34, L −0.10, C +0.18 | +$0.18 / +0.20% | −$0.31 to +$0.57 / −0.34% to +0.63% | Bullish |
| H4 | O +0.08, H +0.58, L −0.42, C +0.22 | O +0.14, H +0.67, L −0.36, C +0.29 | +$0.29 / +0.32% | −$0.64 to +$1.12 / −0.70% to +1.23% | Bullish |
| D1 | O +0.12, H +0.91, L −0.66, C +0.31 | O +0.16, H +0.88, L −0.72, C +0.27 | +$0.27 / +0.30% | −$1.18 to +$1.55 / −1.30% to +1.70% | Mixed |
The key comparison is not whether every horizon agrees. It is whether the post-release re-anchor changes the central path, widens the range, or leaves the longer views intact. For a longer discussion of horizon separation, use the oil prediction price analysis.
When does an oil forecast become stale after payrolls?
A forecast becomes stale when the release arrives inside an unfinished candle or when a revision changes the macro interpretation. The remedy is to preserve the pre-release state, wait for a settled input, and compare the re-anchored horizons.
- Capture the pre-release state across M15, H1, H4, and D1. Failure mode: if the release lands inside an M15 candle, the high, low, and close are not settled, so the apparent reaction can be a partial-candle artifact.
- Re-anchor after the first complete post-release input. Failure mode: an M15 shock may widen the short range while H4 and D1 remain stable, so treating the shortest view as the whole trend creates false agreement.
- Check the unemployment rate, claims context, and later revisions. Failure mode: a revision can reverse the labor-market message, leaving the original post-release path stale even if the first candle looked clean.
PRISM’s hourly AI briefing adds a second layer by reading news against each forecast. It reports direction, risk, and the number of flagged levels when the page is served. Member-only values remain inside the briefing experience.
How should you combine jobs data with other oil signals?
Treat employment data crude oil as one transmission channel, not a complete oil thesis. Inventory balances, supply headlines, the dollar, and the prevailing risk regime can confirm or contradict the labor signal.
If the payroll response conflicts with storage data, compare the event logic with Oil Price Projections: Reading Inventory Data. For a cross-asset check on the rates and dollar channel, the Gold price prediction framework provides a useful neighboring comparison.
Frequently asked questions about the oil forecast after NFP
Does a strong payrolls number always lift WTI?
No. Strong payrolls can improve demand expectations, but higher yields and a firmer dollar can offset that support. The historical base rate is only modestly positive.
What does an 80% close range mean?
It is the model’s central probability band for the forecast close. It describes uncertainty around the expected close; it does not define a guaranteed high or low.
How far ahead does PRISM forecast?
PRISM produces 48-hour OHLC candle forecasts across M15, H1, H4, and D1, supported by an hourly news briefing, an MT5 indicator, and a REST API.
How should you use the jobs-report forecast?
Use the historical percentages as a base rate, the transmission channels as an interpretation map, and the multi-timeframe ranges as uncertainty. Forecasts are model output, not financial advice. To compare the current M15, H1, H4, and D1 WTI views, open the live multi-timeframe forecast dashboard →