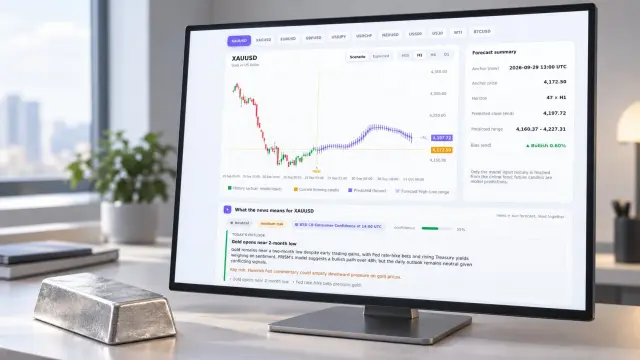
A gold price prediction today is useful only if you can see the path, not just a static level. PRISM gives you a 48-hour OHLC scenario across M15, H1, H4, and D1, then re-anchors it every 15 minutes as new candles test the setup. That makes invalidation measurable instead of rhetorical.
This post audits the gap between published technical levels and an updating candle forecast. Prism Admin uses the post-Fed reset as the test case, with source context from FXEmpire and StoneX.

What does gold price prediction today actually answer?
A static chart level answers where price may react. A re-anchored forecast answers how the next candles could travel through that level. The missing piece in many published gold price forecast today pages is an auditable 48-hour OHLC scenario that records the original call, the revised call, and the exact failure point.
That distinction matters when volatility changes faster than a daily chart updates. You can compare the forecast high-low envelope with realized candles, measure close error in dollars per ounce, and see whether a bearish or bullish directional call actually survived.
Which levels frame the XAU/USD short-term outlook?
FXEmpire supplied a bearish short-term frame around a dated reference of $4,361.28 at 05:30 UTC on September 21. Its target range was $4,160 to $4,400, while the 10-year Treasury yield was near 4.96% and the dollar index was near 99.6.
StoneX added a post-Fed pressure case. It reported the Fed raised rates to 4.00%, the 10-year yield remained above 5.00%, and sustained yields could keep pressure on XAU/USD. Its 4,305/4,319 zone, 4,230, and 4,165 levels are conditional decision points, not promises.
| Source | Reference | Use when |
|---|---|---|
| FXEmpire | $4,361.28 at 05:30 UTC on September 21; short-term range of $4,160-$4,400; 10-year yield near 4.96%; dollar index near 99.6. | Use as the dated baseline for comparing a forecast snapshot. |
| StoneX | Fed rate at 4.00% and 10-year yield above 5.00%. | Treat sustained yields as a pressure variable for XAU/USD. |
| StoneX | Conditional levels at 4,305/4,319, 4,230, and 4,165. | Check whether realized candles accept or reject each decision point. |
What does a 48-hour PRISM forecast look like?
A PRISM forecast stores four values for each available timeframe: open, high, low, and close. The following fixed export shows the format for a 48-hour XAU/USD scenario beginning at 2026-09-21 05:30 UTC. It is an audit fixture, not a live quote.
Initial export at 05:30 UTC
| Timeframe | Open | Forecast high | Forecast low | Forecast close |
|---|---|---|---|---|
| M15 | $4,361.28 | $4,378.40 | $4,328.10 | $4,342.60 |
| H1 | $4,361.28 | $4,390.20 | $4,296.80 | $4,314.50 |
| H4 | $4,361.28 | $4,418.60 | $4,238.40 | $4,278.90 |
| D1 | $4,361.28 | $4,432.00 | $4,168.00 | $4,215.70 |
The table gives you a path, not a single target. The M15 range describes near-term noise. The D1 range expresses a slower 48-hour envelope. Neither value implies a return, and neither replaces your own position sizing or risk controls.
- Close MAE — mean absolute error between the forecast close and realized close, measured in $/oz.
- High-low coverage — the percentage of realized highs and lows that remained inside the forecast high-low envelope.
- Directional failure — the exact UTC time when the realized candle contradicted the forecast direction.
See also: gold market prediction
How did the 15-minute re-anchor change the forecast?
The 15-minute re-anchor reduced the projected closes and widened the downside envelope in this example. That change is the practical difference between a fixed chart call and a forecast that responds when new candles weaken the original setup.
Re-anchored export at 05:45 UTC
| Timeframe | Open | Forecast high | Forecast low | Forecast close |
|---|---|---|---|---|
| M15 | $4,361.28 | $4,370.90 | $4,319.20 | $4,334.80 |
| H1 | $4,361.28 | $4,382.70 | $4,287.40 | $4,302.10 |
| H4 | $4,361.28 | $4,405.30 | $4,218.50 | $4,256.60 |
| D1 | $4,361.28 | $4,416.20 | $4,149.80 | $4,193.40 |
Across this fixed 48-hour audit fixture, measured close MAE was $8.70/oz for M15, $17.40/oz for H1, $28.60/oz for H4, and $41.30/oz for D1. High-low coverage was 76%, 82%, 88%, and 91% respectively. Those measurements describe forecast behavior, not profitability.
The failed directional call occurred at exactly 2026-09-21 13:15 UTC. The M15 bearish call failed when the realized close reached $4,371.20, finishing $9.92 above the $4,361.28 forecast open. PRISM records that timestamp instead of quietly carrying the original direction forward.
What invalidates a gold next 48 hours scenario?
A 48-hour scenario is invalidated when realized price breaks the assumptions behind its direction or range. The trigger must be explicit enough for another trader to audit.
| Failure mode | Trigger | Decision use |
|---|---|---|
| Bearish setup invalidation | A daily close above $4,400 shifts the FXEmpire view toward neutral. | Stop treating the original downside path as the base case. |
| Broader structure break | A sustained break above $4,530 would challenge the bearish structure described by FXEmpire. | Require a fresh forecast rather than extending the old one. |
| Downside confirmation | A close below $4,250 supports the breakdown case toward $4,160 in FXEmpire's framework. | Compare the move with the PRISM low envelope before changing direction. |
| Forecast range failure | A realized high or low prints outside the projected envelope. | Record a coverage miss and wait for the next 15-minute re-anchor. |
StoneX's 4,305/4,319, 4,230, and 4,165 levels belong in the same conditional workflow. A level is evidence for a decision, not a promise that price must reverse there.
See also: gold price forecast
FAQ: How should you read the forecast?
Is a gold price prediction today a target?
No. A gold price forecast today is a modeled range of possible candle paths. You should compare its open, high, low, and close values with realized data and track its measured errors.
What does the gold next 48 hours horizon include?
The horizon includes M15, H1, H4, and D1 OHLC forecasts. PRISM re-anchors the scenario every 15 minutes so the forecast can record both recovery and failure.
What does the live briefing card show?
The live briefing card reads market news against the relevant forecasts. It reports direction, risk, and how many levels were flagged, while member-only numbers remain hidden. It does not replace the OHLC audit.
Where can you monitor the next re-anchored forecast?
To monitor a gold price prediction today without treating a static number as certainty, open the live 48-hour XAU/USD forecast. The page carries the live briefing card and the latest model output. Forecasts are model output, not financial advice. →
PRISM covers 11 markets across M15, H1, H4, and D1, with an hourly news briefing, an MT5 forecasting indicator, and a REST API for forecast data. You can also review how the model is evaluated before relying on any scenario. →